BOX PLOT
绘图 · 第 3 / 36 章
单组箱线图
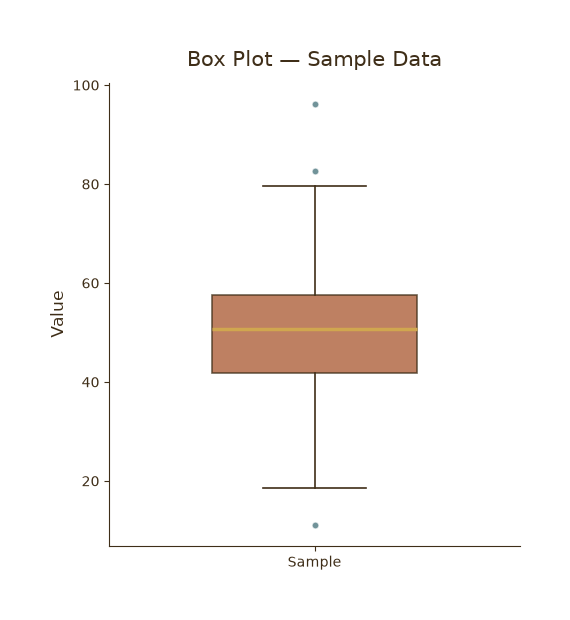
单组箱线图
Python38 行
import matplotlib.pyplot as plt
import numpy as np

COLORS = ["#A8552E", "#35666E", "#D0A64F", "#3F2E18", "#7E8F52"]
BG = "#F7F3EC"

np.random.seed(42)
data = np.random.normal(loc=50, scale=12, size=300)

fig, ax = plt.subplots(figsize=(5, 5.5))
# fig.patch.set_facecolor(BG)
# ax.set_facecolor(BG)

bp = ax.boxplot(
    data,
    widths=0.5,
    patch_artist=True,                      # 允许填充
    boxprops=dict(facecolor=COLORS[0], alpha=0.75, edgecolor=COLORS[3], linewidth=1.2),
    medianprops=dict(color=COLORS[2], linewidth=2.5),   # 中位数用金黄
    whiskerprops=dict(color=COLORS[3], linewidth=1.2),
    capprops=dict(color=COLORS[3], linewidth=1.2),
    flierprops=dict(marker="o", markerfacecolor=COLORS[1],
                    markeredgecolor="white", markersize=5, alpha=0.7),
)

ax.set_title("Box Plot — Sample Data", fontsize=15, color=COLORS[3], pad=12)
ax.set_ylabel("Value", fontsize=12, color=COLORS[3])
ax.set_xticks([1])
ax.set_xticklabels(["Sample"])
ax.tick_params(axis="both", colors=COLORS[3])

for s in ("top", "right"):
    ax.spines[s].set_visible(False)
ax.spines["left"].set_color(COLORS[3])
ax.spines["bottom"].set_color(COLORS[3])

plt.tight_layout()
plt.show()多组对比
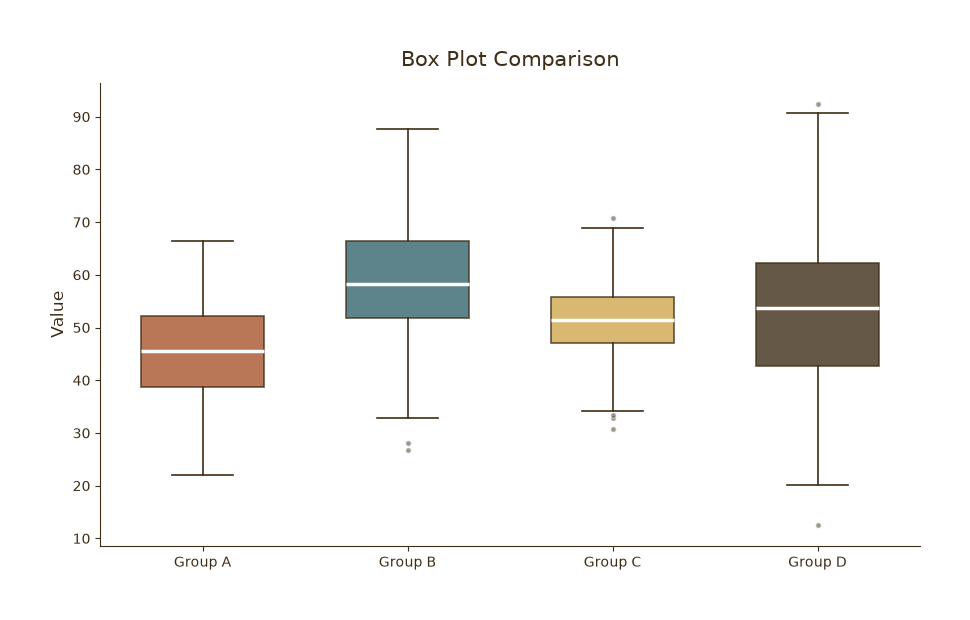
多组对比
Python47 行
import matplotlib.pyplot as plt
import numpy as np

COLORS = ["#A8552E", "#35666E", "#D0A64F", "#3F2E18", "#7E8F52"]
BG = "#F7F3EC"

np.random.seed(0)
groups = {
    "Group A": np.random.normal(45, 9, 200),
    "Group B": np.random.normal(60, 12, 200),
    "Group C": np.random.normal(52, 7, 200),
    "Group D": np.random.normal(55, 15, 200),
}

fig, ax = plt.subplots(figsize=(9, 5.5))
# fig.patch.set_facecolor(BG)
# ax.set_facecolor(BG)

bp = ax.boxplot(
    groups.values(),
    tick_labels=list(groups.keys()),   # ✅ 新版写法
    widths=0.6,
    patch_artist=True,
    medianprops=dict(color="white", linewidth=2.5),
    whiskerprops=dict(color=COLORS[3], linewidth=1.2),
    capprops=dict(color=COLORS[3], linewidth=1.2),
    flierprops=dict(marker="o", markerfacecolor=COLORS[3],
                    markeredgecolor="white", markersize=4, alpha=0.5),
)

for patch, c in zip(bp["boxes"], COLORS):
    patch.set_facecolor(c)
    patch.set_alpha(0.8)
    patch.set_edgecolor(COLORS[3])
    patch.set_linewidth(1.2)

ax.set_title("Box Plot Comparison", fontsize=15, color=COLORS[3], pad=12)
ax.set_ylabel("Value", fontsize=12, color=COLORS[3])
ax.tick_params(axis="both", colors=COLORS[3])

for s in ("top", "right"):
    ax.spines[s].set_visible(False)
ax.spines["left"].set_color(COLORS[3])
ax.spines["bottom"].set_color(COLORS[3])

plt.tight_layout()
plt.show()水平箱线图 + 均值标记
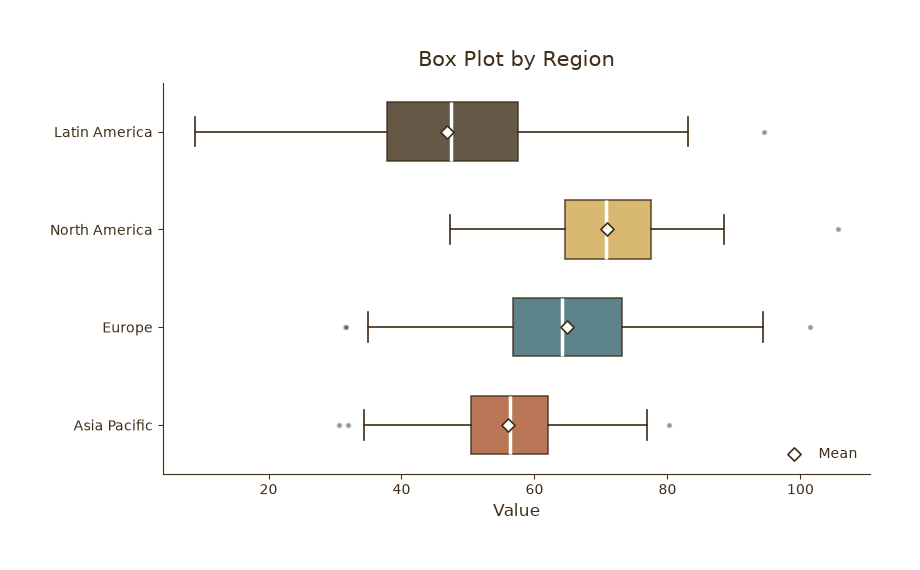
水平箱线图 + 均值标记
Python52 行
import matplotlib.pyplot as plt
import numpy as np

COLORS = ["#A8552E", "#35666E", "#D0A64F", "#3F2E18", "#7E8F52"]

np.random.seed(1)
groups = {
    "Asia Pacific":     np.random.normal(55, 10, 200),
    "Europe":           np.random.normal(65, 12, 200),
    "North America":    np.random.normal(70, 9, 200),
    "Latin America":    np.random.normal(48, 14, 200),
}

fig, ax = plt.subplots(figsize=(8.5, 5))

bp = ax.boxplot(
    groups.values(),
    tick_labels=list(groups.keys()),
    vert=False,                             # 水平
    widths=0.6,
    patch_artist=True,
    medianprops=dict(color="white", linewidth=2.5),
    whiskerprops=dict(color=COLORS[3], linewidth=1.2),
    capprops=dict(color=COLORS[3], linewidth=1.2),
    flierprops=dict(marker="o", markerfacecolor=COLORS[3],
                    markeredgecolor="white", markersize=4, alpha=0.5),
)

for patch, c in zip(bp["boxes"], COLORS):
    patch.set_facecolor(c)
    patch.set_alpha(0.8)
    patch.set_edgecolor(COLORS[3])
    patch.set_linewidth(1.2)

# 叠加均值点(白心 + 主题色描边)
means = [v.mean() for v in groups.values()]
ax.scatter(means, range(1, len(means) + 1),
           marker="D", s=45, facecolor="white",
           edgecolor=COLORS[3], linewidth=1.2, zorder=3, label="Mean")

ax.set_title("Box Plot by Region", fontsize=15, color=COLORS[3], pad=12)
ax.set_xlabel("Value", fontsize=12, color=COLORS[3])
ax.tick_params(axis="both", colors=COLORS[3])
ax.legend(frameon=False, fontsize=10, labelcolor=COLORS[3], loc="lower right")

for s in ("top", "right"):
    ax.spines[s].set_visible(False)
ax.spines["left"].set_color(COLORS[3])
ax.spines["bottom"].set_color(COLORS[3])

plt.tight_layout()
plt.show()