CONNECTED SCATTER PLOT
绘图 · 第 7 / 36 章
基础连通散点
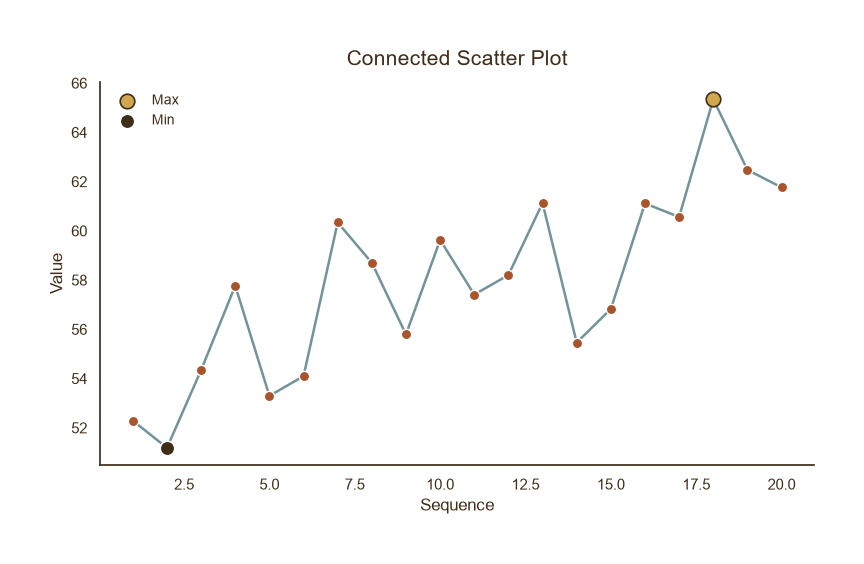
基础连通散点
Python39 行
import matplotlib.pyplot as plt
import numpy as np

COLORS = ["#A8552E", "#35666E", "#D0A64F", "#3F2E18", "#7E8F52"]

np.random.seed(42)
x = np.arange(1, 21)
y = 50 + 0.8 * x + np.random.normal(0, 3, len(x))

fig, ax = plt.subplots(figsize=(8, 5))

# 连线(先画,位于散点下方)
ax.plot(x, y, color=COLORS[1], linewidth=1.8,
        linestyle="-", alpha=0.7, zorder=1)

# 散点(后画,位于上方)
ax.scatter(x, y, s=55, color=COLORS[0],
           edgecolor="white", linewidth=1.0, zorder=2)

# 高亮极值点
imax, imin = np.argmax(y), np.argmin(y)
ax.scatter(x[imax], y[imax], s=110, color=COLORS[2],
           edgecolor=COLORS[3], linewidth=1.2, zorder=3, label="Max")
ax.scatter(x[imin], y[imin], s=110, color=COLORS[3],
           edgecolor="white", linewidth=1.2, zorder=3, label="Min")

ax.set_title("Connected Scatter Plot", fontsize=15, color=COLORS[3], pad=12)
ax.set_xlabel("Sequence", fontsize=12, color=COLORS[3])
ax.set_ylabel("Value", fontsize=12, color=COLORS[3])
ax.tick_params(axis="both", colors=COLORS[3])
ax.legend(frameon=False, fontsize=10, labelcolor=COLORS[3], loc="upper left")

for s in ("top", "right"):
    ax.spines[s].set_visible(False)
ax.spines["left"].set_color(COLORS[3])
ax.spines["bottom"].set_color(COLORS[3])

plt.tight_layout()
plt.show()多序列对比
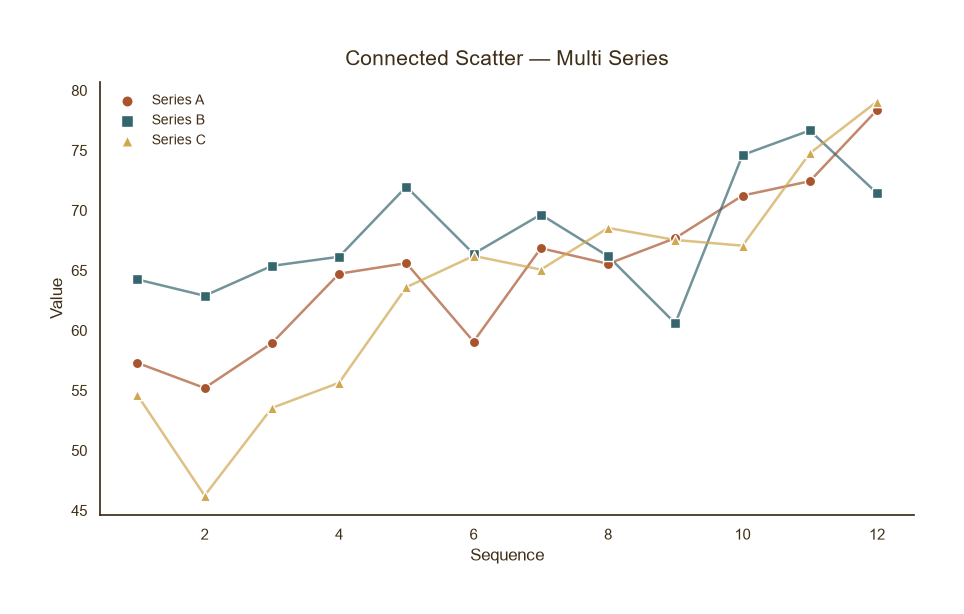
多序列对比
Python37 行
import matplotlib.pyplot as plt
import numpy as np

COLORS = ["#A8552E", "#35666E", "#D0A64F", "#3F2E18", "#7E8F52"]

np.random.seed(0)
x = np.arange(1, 13)
series = {
    "Series A": 50 + 2.0 * x + np.random.normal(0, 3, len(x)),
    "Series B": 60 + 1.2 * x + np.random.normal(0, 4, len(x)),
    "Series C": 45 + 2.8 * x + np.random.normal(0, 3, len(x)),
}
markers = ["o", "s", "^"]   # 标记形状也区分

fig, ax = plt.subplots(figsize=(9, 5.5))

for (name, y), c, m in zip(series.items(), COLORS, markers):
    ax.plot(x, y, color=c, linewidth=1.8, alpha=0.7, zorder=1)
    ax.scatter(x, y, s=55, color=c, marker=m,
               edgecolor="white", linewidth=1.0,
               zorder=2, label=name)

ax.set_title("Connected Scatter — Multi Series",
             fontsize=15, color=COLORS[3], pad=12)
ax.set_xlabel("Sequence", fontsize=12, color=COLORS[3])
ax.set_ylabel("Value", fontsize=12, color=COLORS[3])
ax.tick_params(axis="both", colors=COLORS[3])
ax.legend(frameon=False, fontsize=10, labelcolor=COLORS[3],
          loc="upper left", markerscale=1.1)

for s in ("top", "right"):
    ax.spines[s].set_visible(False)
ax.spines["left"].set_color(COLORS[3])
ax.spines["bottom"].set_color(COLORS[3])

plt.tight_layout()
plt.show()带误差棒的连通散点
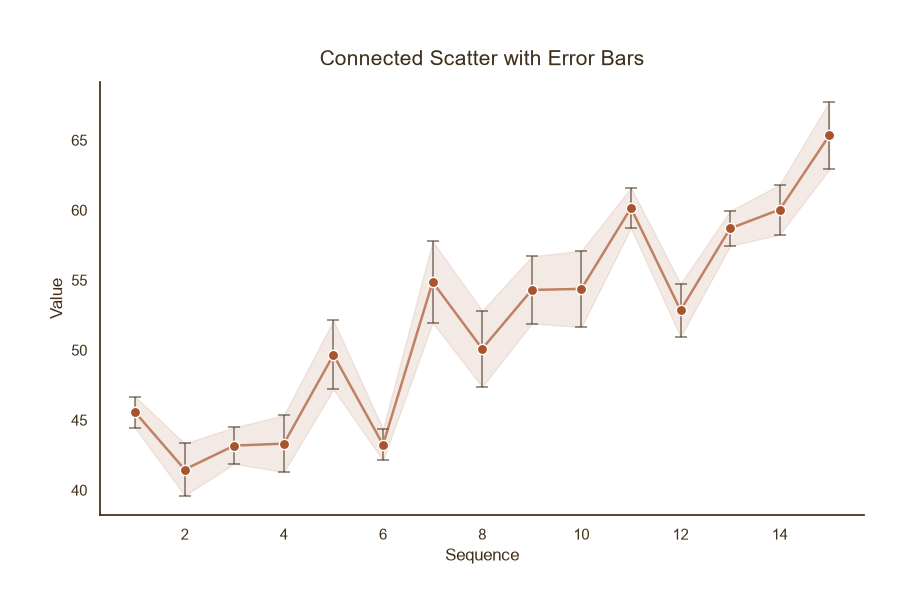
带误差棒的连通散点
Python43 行
import matplotlib.pyplot as plt
import numpy as np

COLORS = ["#A8552E", "#35666E", "#D0A64F", "#3F2E18", "#7E8F52"]

np.random.seed(1)
x = np.arange(1, 16)
y = 40 + 1.5 * x + np.random.normal(0, 2.5, len(x))
err = np.abs(np.random.normal(2, 0.8, len(x)))

fig, ax = plt.subplots(figsize=(8.5, 5.5))

# 误差棒(底层)
ax.errorbar(x, y, yerr=err,
            fmt="none", ecolor=COLORS[3],
            elinewidth=1.2, capsize=4, capthick=1.2,
            alpha=0.6, zorder=1)

# 连线
ax.plot(x, y, color=COLORS[0], linewidth=1.8,
        alpha=0.7, zorder=2)

# 散点
ax.scatter(x, y, s=55, color=COLORS[0],
           edgecolor="white", linewidth=1.0, zorder=3)

# 填充带(均值 ± 误差的带状区域)
ax.fill_between(x, y - err, y + err,
                color=COLORS[0], alpha=0.12, zorder=0)

ax.set_title("Connected Scatter with Error Bars",
             fontsize=15, color=COLORS[3], pad=12)
ax.set_xlabel("Sequence", fontsize=12, color=COLORS[3])
ax.set_ylabel("Value", fontsize=12, color=COLORS[3])
ax.tick_params(axis="both", colors=COLORS[3])

for s in ("top", "right"):
    ax.spines[s].set_visible(False)
ax.spines["left"].set_color(COLORS[3])
ax.spines["bottom"].set_color(COLORS[3])

plt.tight_layout()
plt.show()路径带箭头
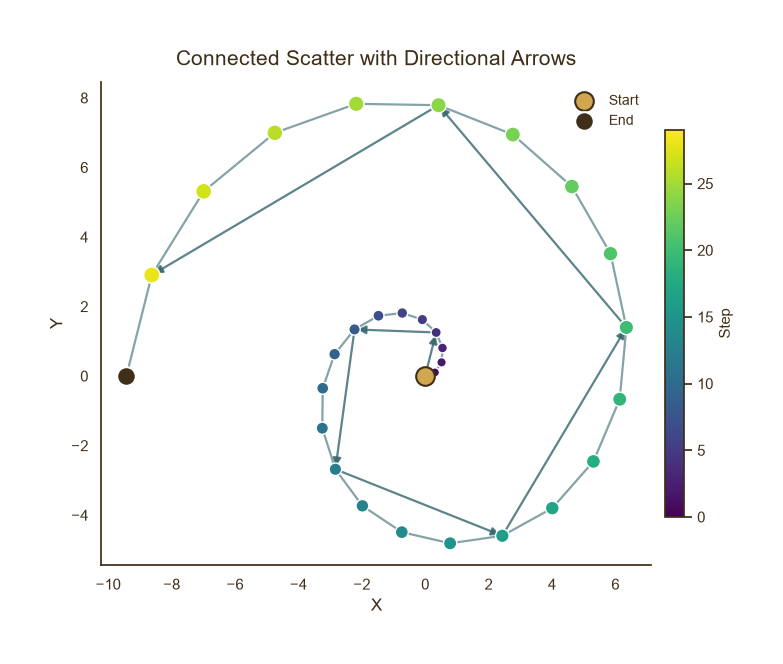
路径带箭头
Python56 行
import matplotlib.pyplot as plt
import numpy as np

COLORS = ["#A8552E", "#35666E", "#D0A64F", "#3F2E18", "#7E8F52"]

np.random.seed(2)
# 参数曲线(螺旋)
t = np.linspace(0, 3 * np.pi, 30)
x = t * np.cos(t)
y = t * np.sin(t)

fig, ax = plt.subplots(figsize=(7.5, 6))

# 连线
ax.plot(x, y, color=COLORS[1], linewidth=1.6, alpha=0.6, zorder=1)

# 每隔 4 个点加箭头
for i in range(0, len(x) - 4, 4):
    ax.annotate("",
                xy=(x[i+4], y[i+4]), xytext=(x[i], y[i]),
                arrowprops=dict(arrowstyle="-|>",
                                color=COLORS[1],
                                lw=1.6, alpha=0.8),
                zorder=2)

# 散点,颜色按顺序渐变
sizes = np.linspace(40, 140, len(x))
sc = ax.scatter(x, y, s=sizes, c=np.arange(len(x)),
                cmap="viridis", edgecolor="white",
                linewidth=1.0, zorder=3)

# 起点 / 终点标记
ax.scatter(x[0], y[0], s=180, color=COLORS[2],
           edgecolor=COLORS[3], linewidth=1.5, zorder=4, label="Start")
ax.scatter(x[-1], y[-1], s=180, color=COLORS[3],
           edgecolor="white", linewidth=1.5, zorder=4, label="End")

cbar = fig.colorbar(sc, ax=ax, shrink=0.8, pad=0.02)
cbar.set_label("Step", fontsize=11, color=COLORS[3])
cbar.ax.tick_params(colors=COLORS[3])
cbar.outline.set_edgecolor(COLORS[3])

ax.set_title("Connected Scatter with Directional Arrows",
             fontsize=15, color=COLORS[3], pad=12)
ax.set_xlabel("X", fontsize=12, color=COLORS[3])
ax.set_ylabel("Y", fontsize=12, color=COLORS[3])
ax.tick_params(axis="both", colors=COLORS[3])
ax.legend(frameon=False, fontsize=10, labelcolor=COLORS[3], loc="upper right")

for s in ("top", "right"):
    ax.spines[s].set_visible(False)
ax.spines["left"].set_color(COLORS[3])
ax.spines["bottom"].set_color(COLORS[3])

plt.tight_layout()
plt.show()