DOUGHNUT
绘图 · 第 23 / 36 章
基础甜甜圈图
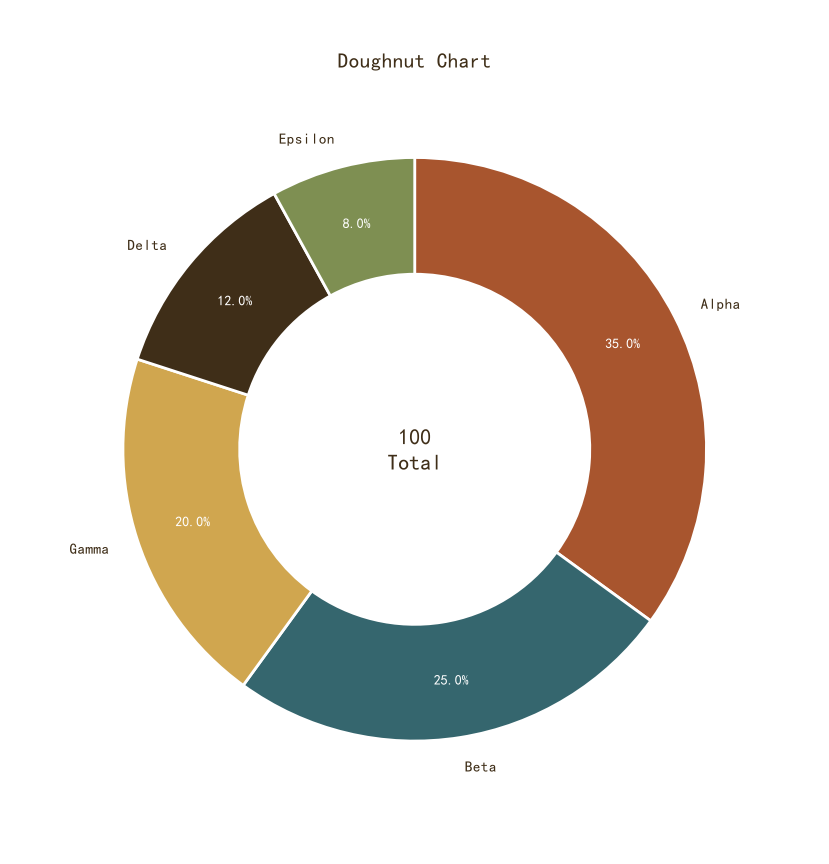
基础甜甜圈图
Python38 行
import matplotlib.pyplot as plt
import numpy as np

COLORS = ["#A8552E", "#35666E", "#D0A64F", "#3F2E18", "#7E8F52"]

labels = ["Alpha", "Beta", "Gamma", "Delta", "Epsilon"]
values = [35, 25, 20, 12, 8]

fig, ax = plt.subplots(figsize=(8, 8))

wedges, texts, autotexts = ax.pie(
    values,
    labels=labels,
    colors=COLORS[:len(values)],
    autopct="%1.1f%%",
    startangle=90,
    counterclock=False,
    pctdistance=0.80,          # ← 关键:把百分比标签推到色环中间
    wedgeprops=dict(width=0.4, edgecolor="white", linewidth=2.0),
    textprops=dict(color=COLORS[3], fontsize=11),
)

# 百分比文字:白字(因为在深色环上)
for at in autotexts:
    at.set_color("white")
    at.set_fontsize(10)
    at.set_fontweight("bold")

# 中心文字
total = sum(values)
ax.text(0, 0, f"{total}\nTotal", ha="center", va="center",
        fontsize=16, color=COLORS[3], fontweight="bold")

ax.set_title("Doughnut Chart", fontsize=15, color=COLORS[3], pad=12)
ax.set_aspect("equal")

plt.tight_layout()
plt.show()中心标注关键指标
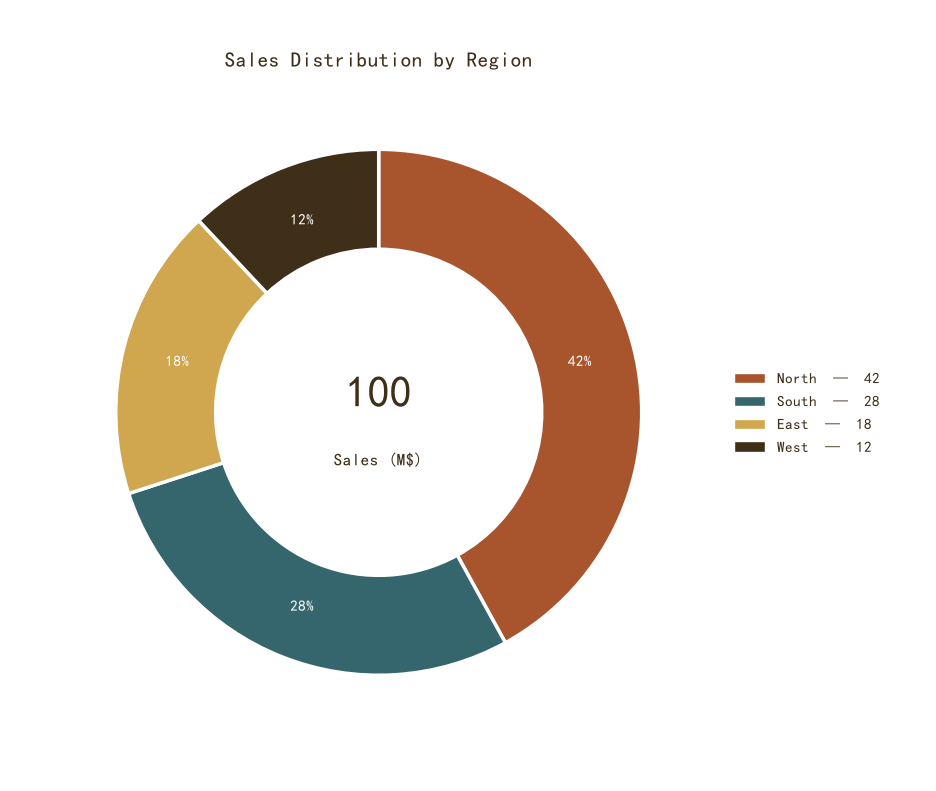
中心标注关键指标
Python45 行
import matplotlib.pyplot as plt
import numpy as np

COLORS = ["#A8552E", "#35666E", "#D0A64F", "#3F2E18", "#7E8F52"]
BG = "#F7F3EC"

labels = ["North", "South", "East", "West"]
values = [42, 28, 18, 12]
total = sum(values)

fig, ax = plt.subplots(figsize=(8.5, 8))

wedges, texts, autotexts = ax.pie(
    values,
    labels=None,                    # 标签移到图例
    colors=COLORS[:len(values)],
    autopct=lambda p: f"{p:.0f}%",
    startangle=90,
    counterclock=False,
    pctdistance=0.79,               # 百分比在环中间
    wedgeprops=dict(width=0.38, edgecolor="white", linewidth=2.5),
    textprops=dict(color="white", fontsize=11, fontweight="bold"),
)

# 中心:总量 + 单位
ax.text(0, 0.08, f"{total}", ha="center", va="center",
        fontsize=32, color=COLORS[3], fontweight="bold")
ax.text(0, -0.18, "Sales (M$)", ha="center", va="center",
        fontsize=12, color=COLORS[3])

ax.set_title("Sales Distribution by Region",
             fontsize=15, color=COLORS[3], pad=12)

# 图例(含数值)
from matplotlib.patches import Patch
handles = [Patch(facecolor=c, edgecolor="white",
                 label=f"{name}  —  {v}")
           for name, v, c in zip(labels, values, COLORS)]
ax.legend(handles=handles, frameon=False, fontsize=11,
          labelcolor=COLORS[3], loc="center left",
          bbox_to_anchor=(1.02, 0.5))

ax.set_aspect("equal")
plt.tight_layout()
plt.show()半环甜甜圈
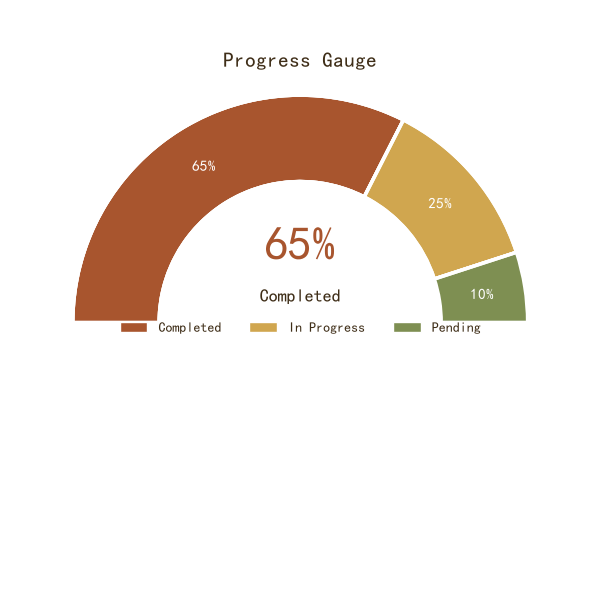
半环甜甜圈
Python57 行
import matplotlib.pyplot as plt
import numpy as np
from matplotlib.patches import Patch

COLORS = ["#A8552E", "#35666E", "#D0A64F", "#3F2E18", "#7E8F52"]
BG = "#F7F3EC"

values = [65, 25, 10]
labels = ["Completed", "In Progress", "Pending"]
colors_used = [COLORS[0], COLORS[2], COLORS[4]]

fig, ax = plt.subplots(figsize=(9, 5.5))

# 把占比换算成角度(总共 180°)
total = sum(values)
angles = [v / total * 180 for v in values]

# 手动画三个半环扇形
start = 180  # 从左侧开始
for ang, color in zip(angles, colors_used):
    ax.pie(
        [ang, 360 - ang],           # 该段 + 剩余补满整圆
        colors=[color, "none"],     # 剩余部分透明
        startangle=start,
        counterclock=False,
        wedgeprops=dict(width=0.38, edgecolor="white", linewidth=2.5),
    )
    start -= ang

# 百分比标签位置
start = 180
for ang, v in zip(angles, values):
    mid = np.deg2rad(start - ang / 2)
    x, y = 0.81 * np.cos(mid), 0.81 * np.sin(mid)
    ax.text(x, y, f"{v}%", ha="center", va="center",
            color="white", fontsize=11, fontweight="bold")
    start -= ang

ax.set_ylim(-0.05, 1.05)
ax.set_xlim(-1.1, 1.1)

ax.text(0, 0.35, "65%", ha="center", va="center",
        fontsize=34, color=COLORS[0], fontweight="bold")
ax.text(0, 0.12, "Completed", ha="center", va="center",
        fontsize=13, color=COLORS[3])

ax.set_title("Progress Gauge", fontsize=15, color=COLORS[3], pad=12)

handles = [Patch(facecolor=c, edgecolor="white", label=name)
           for name, c in zip(labels, colors_used)]
ax.legend(handles=handles, frameon=False, fontsize=10,
          labelcolor=COLORS[3], loc="lower center",
          ncol=3, bbox_to_anchor=(0.5, -0.05))

ax.set_aspect("equal")
plt.tight_layout()
plt.show()多环嵌套甜甜圈(旭日图变体)
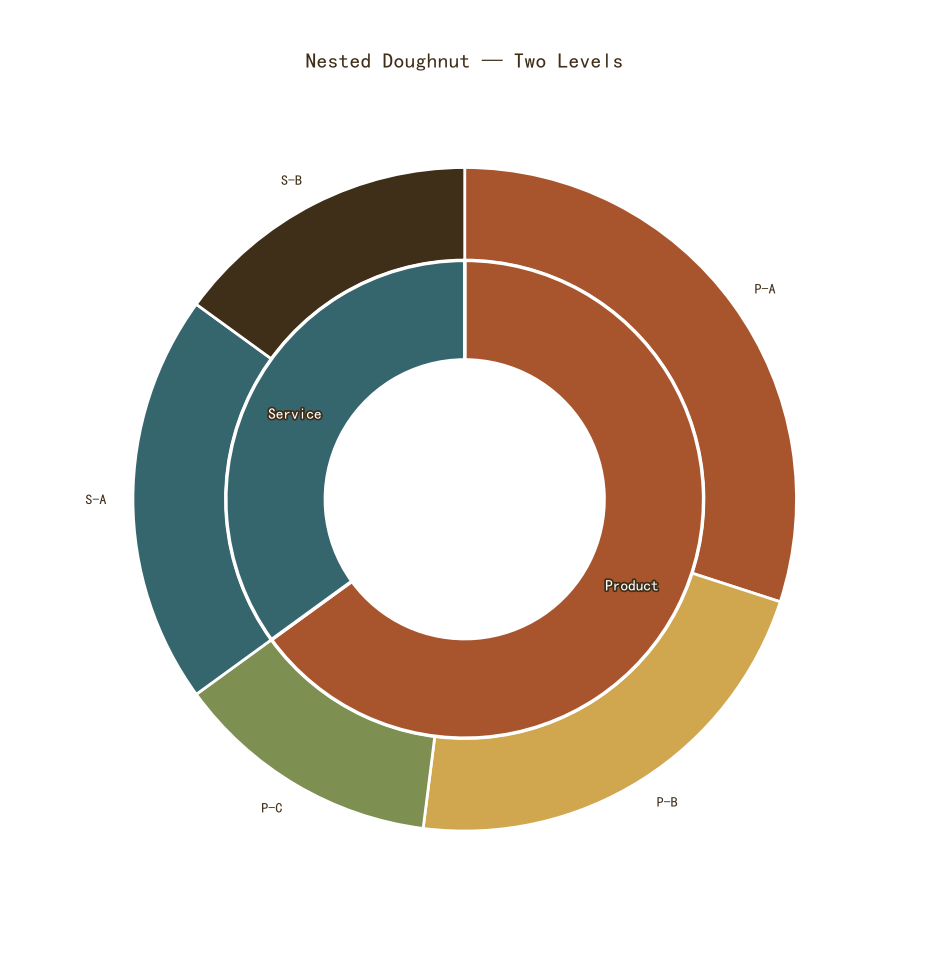
多环嵌套甜甜圈(旭日图变体)
Python63 行
import matplotlib.pyplot as plt
import numpy as np
import matplotlib.patheffects as pe

COLORS = ["#A8552E", "#35666E", "#D0A64F", "#3F2E18", "#7E8F52"]
BG = "#F7F3EC"

inner_labels = ["Product", "Service"]
inner_values = [65, 35]
outer_labels = ["P-A", "P-B", "P-C", "S-A", "S-B"]
outer_values = [30, 22, 13, 20, 15]

fig, ax = plt.subplots(figsize=(9, 9))

# 外环
outer_colors = [COLORS[0], COLORS[2], COLORS[4], COLORS[1], COLORS[3]]
ax.pie(
    outer_values,
    radius=1.0,
    colors=outer_colors,
    labels=outer_labels,
    labeldistance=1.08,
    startangle=90,
    pctdistance=0.9,
    counterclock=False,
    wedgeprops=dict(width=0.28, edgecolor="white", linewidth=2.0),
    textprops=dict(color=COLORS[3], fontsize=10),
)

# 内环:不画 labels,手动放
ax.pie(
    inner_values,
    radius=0.72,
    colors=[COLORS[0], COLORS[1]],
    startangle=90,
    counterclock=False,
    wedgeprops=dict(width=0.30, edgecolor="white", linewidth=2.5),
)

# 手动把内环标签放到色环正中(半径 0.57)
inner_mid_r = 0.72 - 0.30 / 2   # 0.57
start = 90
total_inner = sum(inner_values)
for val, lab in zip(inner_values, inner_labels):
    span = 360 * val / total_inner
    mid_ang = np.deg2rad(start - span / 2)
    ax.text(
        inner_mid_r * np.cos(mid_ang),
        inner_mid_r * np.sin(mid_ang),
        lab,
        ha="center", va="center",
        fontsize=11, fontweight="bold",
        color="white",
        path_effects=[pe.withStroke(linewidth=2.5, foreground=COLORS[3])],
    )
    start -= span

ax.set_title("Nested Doughnut — Two Levels",
             fontsize=15, color=COLORS[3], pad=12)
ax.set_aspect("equal")

plt.tight_layout()
plt.show()带引导线的甜甜圈
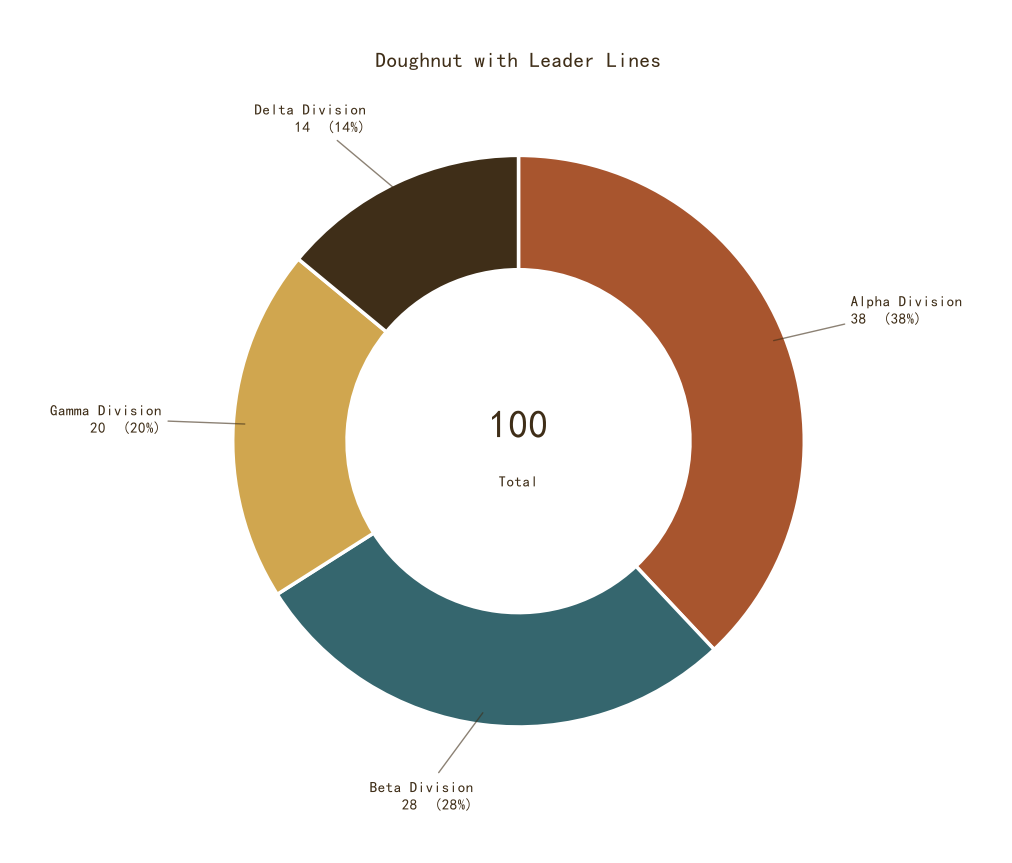
带引导线的甜甜圈
Python58 行
import matplotlib.pyplot as plt
import numpy as np

COLORS = ["#A8552E", "#35666E", "#D0A64F", "#3F2E18", "#7E8F52"]
BG = "#F7F3EC"

labels = ["Alpha Division", "Beta Division",
          "Gamma Division", "Delta Division"]
values = [38, 28, 20, 14]

fig, ax = plt.subplots(figsize=(10, 8))

wedges, texts = ax.pie(
    values,
    labels=None,
    colors=COLORS[:len(values)],
    startangle=90,
    counterclock=False,
    wedgeprops=dict(width=0.4, edgecolor="white", linewidth=2.5),
    labeldistance=1.15,
)

# 手动加外部标签 + 引导线
total = sum(values)
for i, (wedge, label, val) in enumerate(zip(wedges, labels, values)):
    ang = (wedge.theta2 + wedge.theta1) / 2
    x = np.cos(np.deg2rad(ang))
    y = np.sin(np.deg2rad(ang))

    # 引导线终点
    x_text = 1.25 * x
    y_text = 1.25 * y

    # 引导线
    ax.annotate(
        f"{label}\n{val}  ({val / total * 100:.0f}%)",
        xy=(0.95 * x, 0.95 * y),         # 环边缘
        xytext=(x_text, y_text),          # 文字位置
        ha="left" if x >= 0 else "right",
        va="center",
        fontsize=11,
        color=COLORS[3],
        arrowprops=dict(arrowstyle="-", color=COLORS[3],
                        linewidth=1.0, alpha=0.6),
    )

# 中心总量
ax.text(0, 0.06, f"{total}", ha="center", va="center",
        fontsize=28, color=COLORS[3], fontweight="bold")
ax.text(0, -0.14, "Total", ha="center", va="center",
        fontsize=11, color=COLORS[3])

ax.set_title("Doughnut with Leader Lines",
             fontsize=15, color=COLORS[3], pad=12)
ax.set_aspect("equal")

plt.tight_layout()
plt.show()