ARC
绘图 · 第 34 / 36 章
基础弧线图(单向流向)
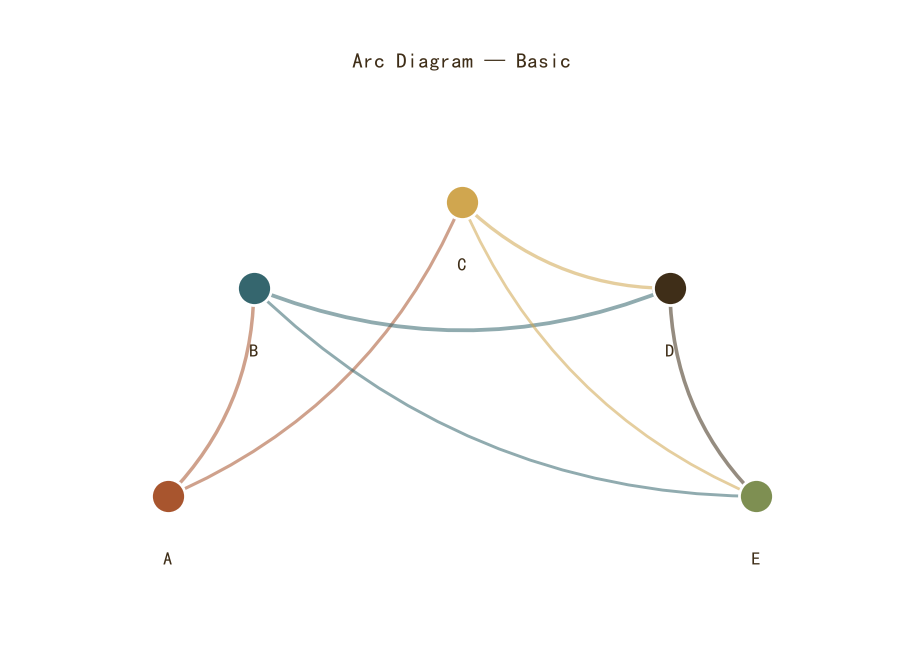
基础弧线图(单向流向)
Python65 行
import matplotlib.pyplot as plt
import numpy as np
from matplotlib.patches import FancyArrowPatch

COLORS = ["#A8552E", "#35666E", "#D0A64F", "#3F2E18", "#7E8F52"]
BG = "#F7F3EC"

# 起点 → 终点(用索引表示)
nodes = ["A", "B", "C", "D", "E"]
edges = [
    (0, 1, 20),
    (0, 2, 15),
    (1, 3, 25),
    (2, 3, 18),
    (1, 4, 12),
    (3, 4, 22),
    (2, 4, 10),
]

n = len(nodes)
# 节点放在上半圆的弧上
angles = np.linspace(np.pi, 0, n)
xs = np.cos(angles)
ys = np.sin(angles)

fig, ax = plt.subplots(figsize=(10, 6))

# 画节点
for i, (x, y, name) in enumerate(zip(xs, ys, nodes)):
    ax.scatter(x, y, s=600, color=COLORS[i],
               edgecolor="white", linewidth=2.0, zorder=5)
    ax.text(x, y - 0.18, name, ha="center", va="top",
            fontsize=13, color=COLORS[3], fontweight="bold")

# 画弧线
for src, tgt, weight in edges:
    x1, y1 = xs[src], ys[src]
    x2, y2 = xs[tgt], ys[tgt]

    # 用 FancyArrowPatch 的 arc3 画弧
    # rad 控制弧的弯曲方向:正值向上,负值向下
    rad = 0.2 if src < tgt else -0.2

    arrow = FancyArrowPatch(
        (x1, y1), (x2, y2),
        connectionstyle=f"arc3,rad={rad}",
        arrowstyle="-|>",
        mutation_scale=15,
        color=COLORS[src],
        linewidth=1.5 + weight * 0.05,
        alpha=0.55,
        zorder=3,
    )
    ax.add_patch(arrow)

ax.set_xlim(-1.4, 1.4)
ax.set_ylim(-0.4, 1.4)
ax.set_aspect("equal")
ax.axis("off")

ax.set_title("Arc Diagram — Basic",
             fontsize=15, color=COLORS[3], pad=12)

plt.tight_layout()
plt.show()线性弧线图(节点在一条线上)
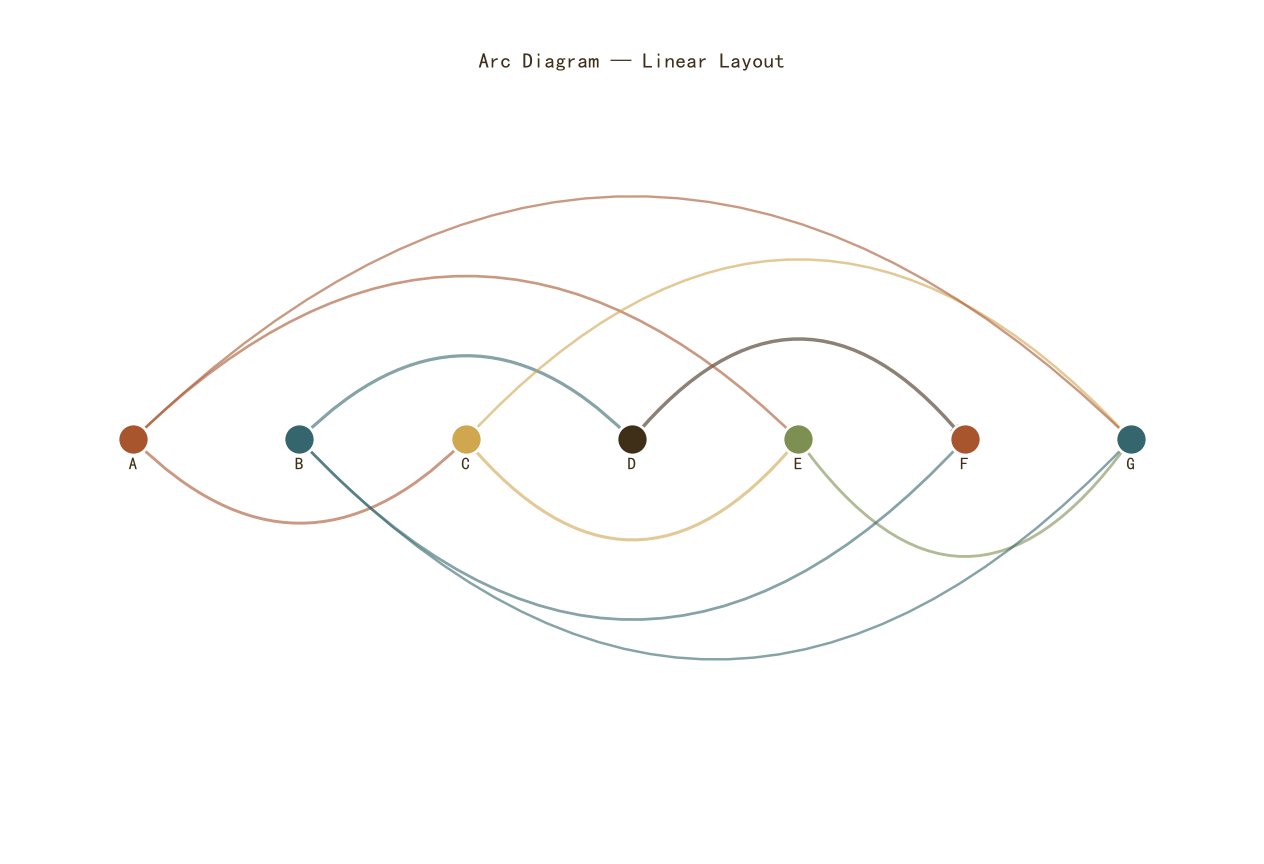
线性弧线图(节点在一条线上)
Python72 行
import matplotlib.pyplot as plt
import numpy as np
from matplotlib.patches import FancyArrowPatch

COLORS = ["#A8552E", "#35666E", "#D0A64F", "#3F2E18", "#7E8F52"]
BG = "#F7F3EC"

nodes = ["A", "B", "C", "D", "E", "F", "G"]
edges = [
    (0, 2, 15), (0, 4, 10), (1, 3, 20), (1, 5, 12),
    (2, 4, 18), (2, 6, 8), (3, 5, 25), (4, 6, 14),
    (0, 6, 5), (1, 6, 7),
]

n = len(nodes)
xs = np.arange(n)

fig, ax = plt.subplots(figsize=(12, 8))

# ============ 关键:弧高随跨度增长 + 同侧分层错开 ============
BASE_H = 0.22      # 基础弧高
SCALE  = 0.14      # 跨度带来的额外弧高
max_span = max(abs(t - s) for s, t, _ in edges)

# 先按跨度排序,再奇偶交替分配到上下两侧,避免一侧过挤
edges_sorted = sorted(edges, key=lambda e: abs(e[1] - e[0]))
up_edges, down_edges = [], []
for i, e in enumerate(edges_sorted):
    (up_edges if i % 2 == 0 else down_edges).append(e)

def draw_group(group, sign):
    """sign=+1 向上,-1 向下;同侧按跨度排序,依次加大弧高避免重叠"""
    group_sorted = sorted(group, key=lambda e: abs(e[1] - e[0]))
    for level, (src, tgt, weight) in enumerate(group_sorted):
        x1, x2 = xs[src], xs[tgt]
        span = abs(x2 - x1)
        h = BASE_H + SCALE * span + level * 0.10
        rad = sign * (2 * h / span)

        arrow = FancyArrowPatch(
            (x1, 0), (x2, 0),
            connectionstyle=f"arc3,rad={rad}",
            arrowstyle="-|>",
            mutation_scale=14,
            color=COLORS[src % len(COLORS)],
            linewidth=1.5 + weight * 0.04,
            alpha=0.6,
            zorder=3,
        )
        ax.add_patch(arrow)

draw_group(up_edges,   +1)
draw_group(down_edges, -1)

# 画节点
for i, (x, name) in enumerate(zip(xs, nodes)):
    ax.scatter(x, 0, s=500, color=COLORS[i % len(COLORS)],
               edgecolor="white", linewidth=2.0, zorder=5)
    ax.text(x, -0.08, name, ha="center", va="top",
            fontsize=12, color=COLORS[3], fontweight="bold")

# ============ 动态 ylim:按实际最大弧高留白 ============
max_h = BASE_H + SCALE * max_span + max(len(up_edges), len(down_edges)) * 0.10
ax.set_xlim(-0.5, n - 0.5)
ax.set_ylim(-max_h - 0.35, max_h + 0.25)
ax.axis("off")               # 去掉 set_aspect("equal"),避免 y 轴被压扁

ax.set_title("Arc Diagram — Linear Layout",
             fontsize=15, color=COLORS[3], pad=12)

plt.tight_layout()
plt.show()按流量着色 + 箭头方向
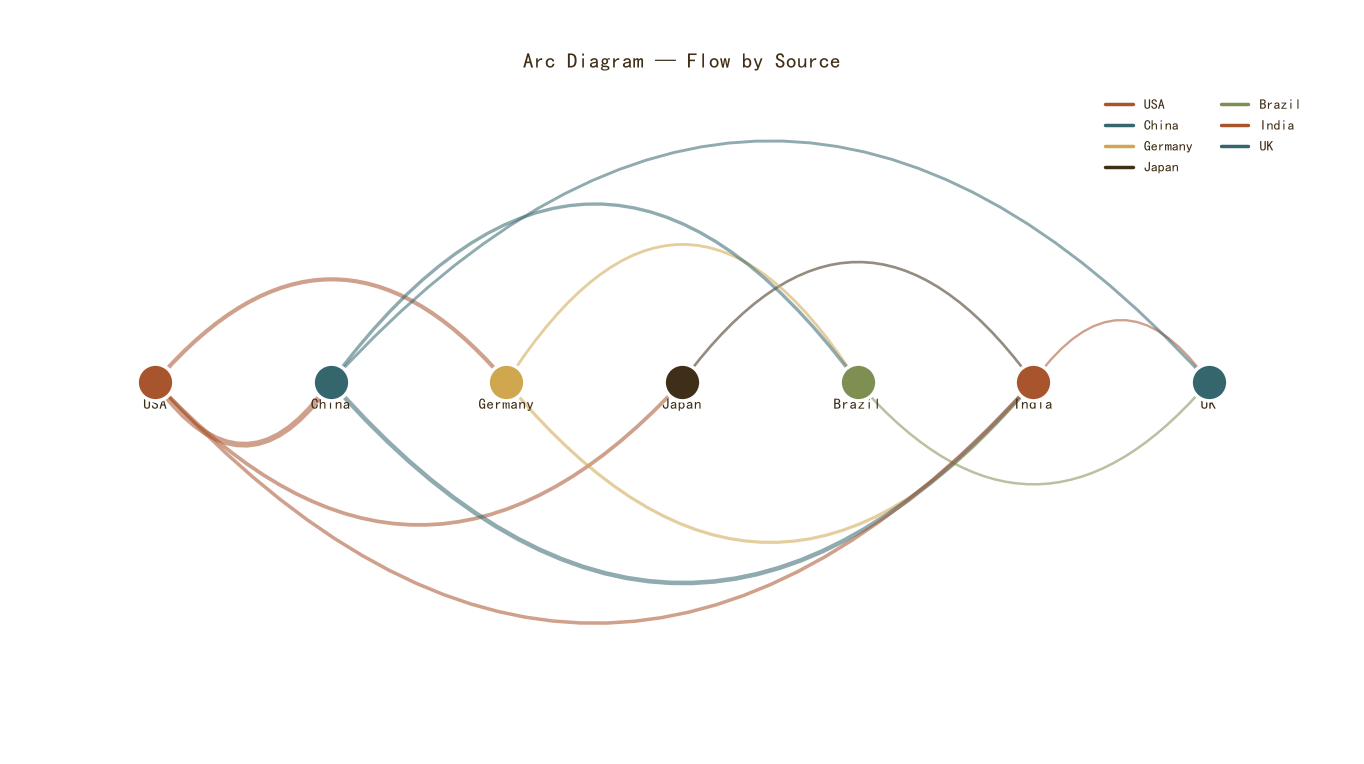
按流量着色 + 箭头方向
Python80 行
import matplotlib.pyplot as plt
import numpy as np
from matplotlib.patches import FancyArrowPatch
from matplotlib.lines import Line2D

COLORS = ["#A8552E", "#35666E", "#D0A64F", "#3F2E18", "#7E8F52"]
BG = "#F7F3EC"

nodes = ["USA", "China", "Germany", "Japan", "Brazil", "India", "UK"]
edges = [
    (0, 1, 50), (0, 2, 30), (0, 3, 25),
    (1, 4, 20), (1, 5, 35), (1, 6, 15),
    (2, 5, 18), (3, 5, 12), (4, 6, 10),
    (5, 6, 8), (0, 5, 22), (2, 4, 14),
]

n = len(nodes)
xs = np.arange(n)

fig, ax = plt.subplots(figsize=(13, 7))

# ============ 关键:弧高随跨度增长(不是固定 rad,也不是固定弧高) ============
BASE_H = 0.22       # 短边的基础弧高
SCALE  = 0.13       # 跨度带来的额外弧高系数
max_span = max(abs(t - s) for s, t, _ in edges)

# 先按"方向"分组,上下交替时同侧多条边再错开
up_edges, down_edges = [], []
for k, (src, tgt, w) in enumerate(edges):
    (up_edges if k % 2 == 0 else down_edges).append((src, tgt, w))

def draw_group(group, sign):
    """sign=+1 向上,-1 向下;同侧按跨度排序,依次加大弧高避免重叠"""
    group_sorted = sorted(group, key=lambda e: abs(e[1] - e[0]))
    for level, (src, tgt, weight) in enumerate(group_sorted):
        x1, x2 = xs[src], xs[tgt]
        span = abs(x2 - x1)
        # 弧高 = 基础 + 跨度贡献 + 同侧层叠偏移
        h = BASE_H + SCALE * span + level * 0.10
        rad = sign * (2 * h / span)

        arrow = FancyArrowPatch(
            (x1, 0), (x2, 0),
            connectionstyle=f"arc3,rad={rad}",
            arrowstyle="-|>",
            mutation_scale=13,
            color=COLORS[src % len(COLORS)],
            linewidth=1.2 + weight * 0.06,
            alpha=0.55,
            zorder=3,
        )
        ax.add_patch(arrow)

draw_group(up_edges,   +1)
draw_group(down_edges, -1)

# 节点
for i, (x, name) in enumerate(zip(xs, nodes)):
    ax.scatter(x, 0, s=700, color=COLORS[i % len(COLORS)],
               edgecolor="white", linewidth=2.5, zorder=5)
    ax.text(x, -0.08, name, ha="center", va="top",
            fontsize=11, color=COLORS[3], fontweight="bold")

# ============ 动态计算 ylim:按实际最大弧高留白 ============
max_h = BASE_H + SCALE * max_span + max(len(up_edges), len(down_edges)) * 0.10
ax.set_xlim(-0.6, n - 0.4)
ax.set_ylim(-max_h - 0.45, max_h + 0.25)
ax.axis("off")

ax.set_title("Arc Diagram — Flow by Source",
             fontsize=15, color=COLORS[3], pad=12)

handles = [Line2D([0], [0], color=COLORS[i % len(COLORS)],
                  linewidth=2.5, label=nodes[i])
           for i in range(len(nodes))]
ax.legend(handles=handles, frameon=False, fontsize=10,
          labelcolor=COLORS[3], loc="upper right", ncol=2)

plt.tight_layout()
plt.show()圆弧布局
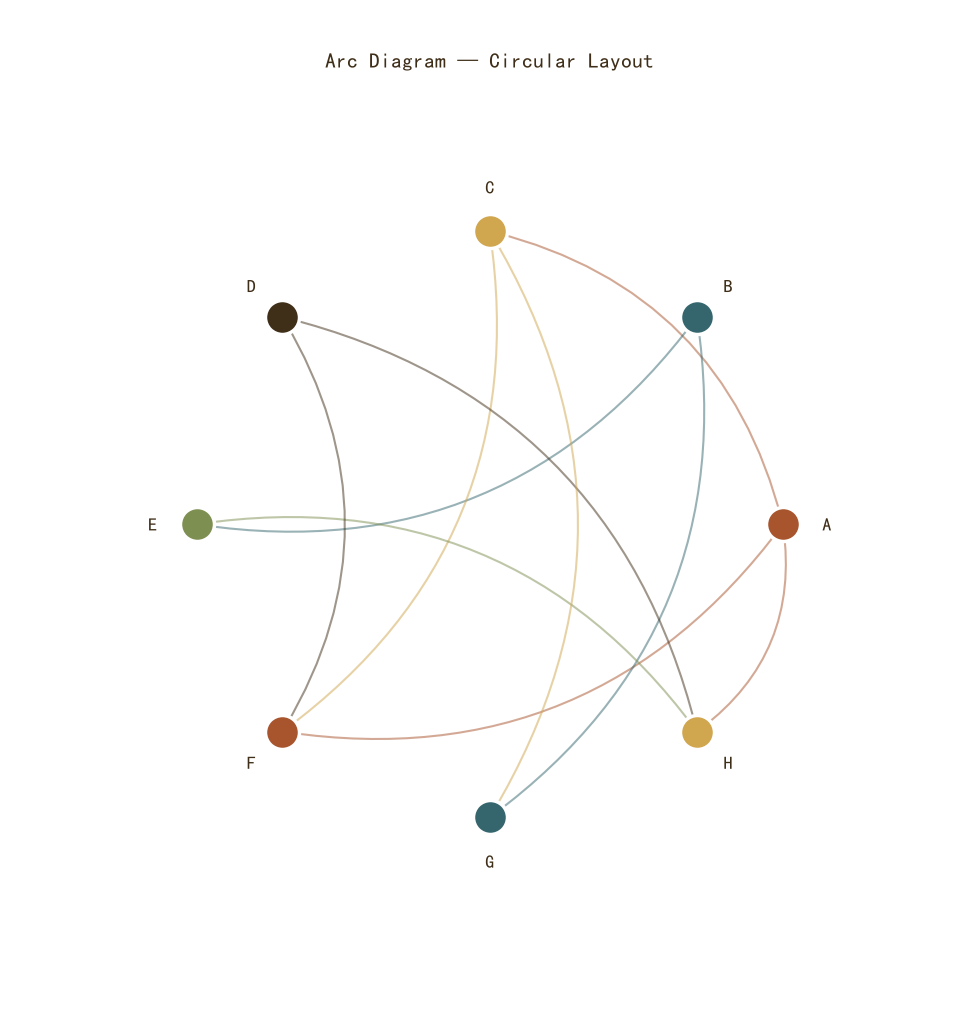
圆弧布局
Python61 行
import matplotlib.pyplot as plt
import numpy as np
from matplotlib.patches import FancyArrowPatch

COLORS = ["#A8552E", "#35666E", "#D0A64F", "#3F2E18", "#7E8F52"]
BG = "#F7F3EC"

nodes = ["A", "B", "C", "D", "E", "F", "G", "H"]
edges = [
    (0, 2), (0, 5), (1, 4), (1, 6), (2, 5),
    (3, 7), (4, 7), (2, 6), (0, 7), (3, 5),
]

n = len(nodes)
angles = np.linspace(0, 2 * np.pi, n, endpoint=False)
xs = np.cos(angles)
ys = np.sin(angles)

fig, ax = plt.subplots(figsize=(9.5, 9.5))

# 画弧
for src, tgt in edges:
    x1, y1 = xs[src], ys[src]
    x2, y2 = xs[tgt], ys[tgt]

    # 计算弧度方向:让弧向圆心弯
    mid_angle = (angles[src] + angles[tgt]) / 2
    rad = 0.3 if np.cos(mid_angle) > 0 else -0.3

    arrow = FancyArrowPatch(
        (x1, y1), (x2, y2),
        connectionstyle=f"arc3,rad={rad}",
        arrowstyle="-|>",
        mutation_scale=12,
        color=COLORS[src % len(COLORS)],
        linewidth=1.5,
        alpha=0.5,
        zorder=3,
    )
    ax.add_patch(arrow)

# 画节点
for i, (x, y, name) in enumerate(zip(xs, ys, nodes)):
    ax.scatter(x, y, s=600, color=COLORS[i % len(COLORS)],
               edgecolor="white", linewidth=2.5, zorder=5)
    # 标签在圆外
    offset = 0.15
    ax.text(x * (1 + offset), y * (1 + offset), name,
            ha="center", va="center",
            fontsize=13, color=COLORS[3], fontweight="bold")

ax.set_xlim(-1.5, 1.5)
ax.set_ylim(-1.5, 1.5)
ax.set_aspect("equal")
ax.axis("off")

ax.set_title("Arc Diagram — Circular Layout",
             fontsize=15, color=COLORS[3], pad=12)

plt.tight_layout()
plt.show()带权重的弧线图
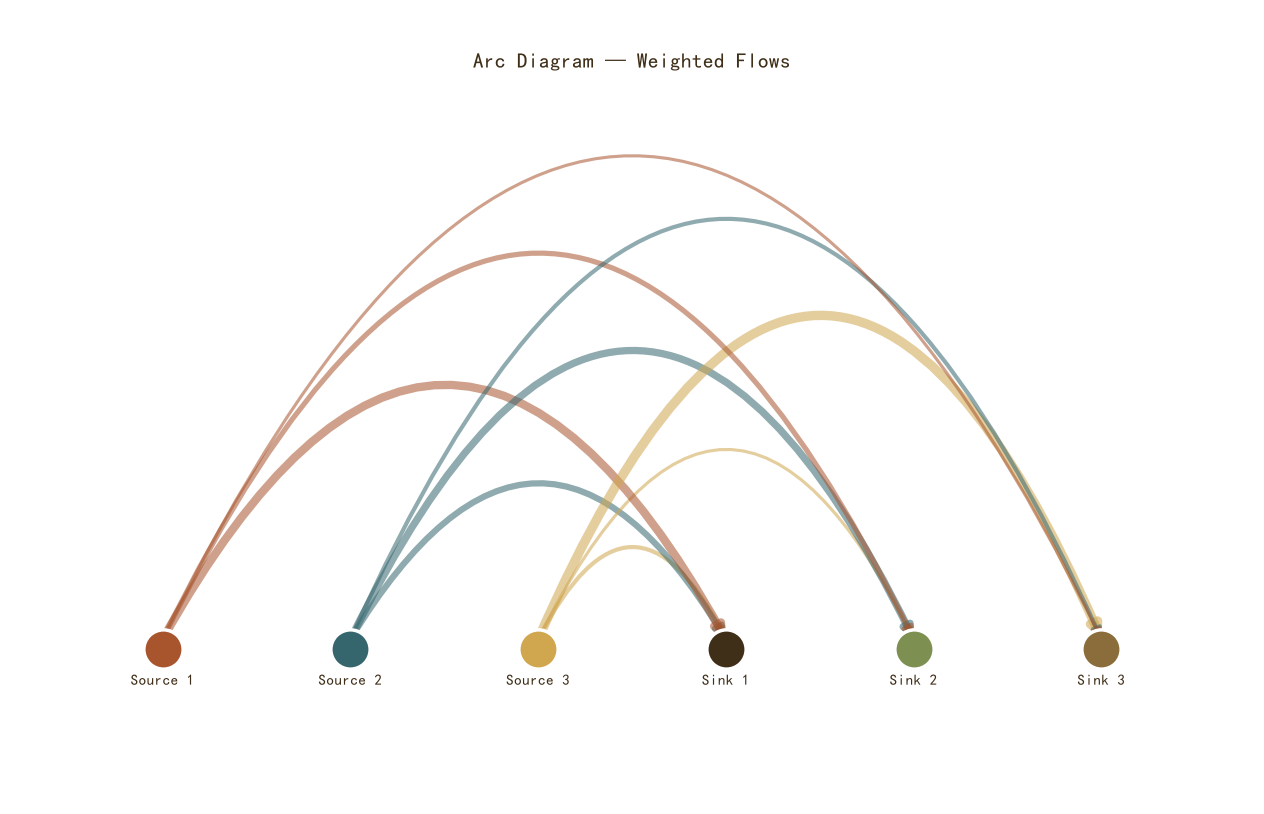
带权重的弧线图
Python79 行
import matplotlib.pyplot as plt
import numpy as np
from matplotlib.patches import FancyArrowPatch, PathPatch
from matplotlib.path import Path

COLORS = ["#A8552E", "#35666E", "#D0A64F", "#3F2E18", "#7E8F52", "#8A6D3B"]
BG = "#F7F3EC"

nodes = ["Source 1", "Source 2", "Source 3",
         "Sink 1", "Sink 2", "Sink 3"]
edges = [
    (0, 3, 40), (0, 4, 25), (0, 5, 15),
    (1, 3, 30), (1, 4, 35), (1, 5, 20),
    (2, 3, 20), (2, 4, 15), (2, 5, 45),
]

n = len(nodes)
xs = np.arange(n)

fig, ax = plt.subplots(figsize=(12, 7.5))

# ============ 关键:手动构造二次贝塞尔,顶点高度可控 ============
BASE_H = 0.35      # 基础弧高
SCALE  = 0.15      # 跨度带来的额外弧高
LAYER  = 0.18      # 同侧相邻层的间隔

max_span = max(abs(t - s) for s, t, _ in edges)
edges_sorted = sorted(edges, key=lambda e: abs(e[1] - e[0]))

for level, (src, tgt, weight) in enumerate(edges_sorted):
    x1, x2 = xs[src], xs[tgt]
    span = abs(x2 - x1)
    # 弧顶高度 = 基础 + 跨度贡献 + 层叠偏移
    h = BASE_H + SCALE * span + level * LAYER

    # 二次贝塞尔:起点、控制点、终点
    # 控制点放在中点上方 h*2 处(二次贝塞尔顶点 = 控制点高度的一半)
    xm = (x1 + x2) / 2
    ctrl = (xm, 2 * h)      # 控制点
    verts = [(x1, 0.05), ctrl, (x2, 0.05)]
    codes = [Path.MOVETO, Path.CURVE3, Path.CURVE3]
    path = Path(verts, codes)

    # 箭头用 FancyArrowPatch 沿路径绘制
    arrow = FancyArrowPatch(
        path=path,
        arrowstyle="-|>",
        mutation_scale=14,
        color=COLORS[src],
        linewidth=weight * 0.15,
        alpha=0.55,
        zorder=3,
    )
    ax.add_patch(arrow)

# 节点
for i in range(3):
    ax.scatter(xs[i], 0, s=800, color=COLORS[i],
               edgecolor="white", linewidth=2.5, zorder=5)
    ax.text(xs[i], -0.12, nodes[i], ha="center", va="top",
            fontsize=11, color=COLORS[3], fontweight="bold")

for i in range(3, 6):
    ax.scatter(xs[i], 0, s=800, color=COLORS[i],
               edgecolor="white", linewidth=2.5, zorder=5)
    ax.text(xs[i], -0.12, nodes[i], ha="center", va="top",
            fontsize=11, color=COLORS[3], fontweight="bold")

# ============ 动态 ylim ============
max_h = BASE_H + SCALE * max_span + (len(edges_sorted) - 1) * LAYER
ax.set_xlim(-0.6, n - 0.4)
ax.set_ylim(-0.6, max_h + 0.4)
ax.axis("off")

ax.set_title("Arc Diagram — Weighted Flows",
             fontsize=15, color=COLORS[3], pad=12)

plt.tight_layout()
plt.show()