文章Matplotlib第 3 章
折线图
Matplotlib · 第 3 / 43 章
折线 / 散点 plot()
几种数据传入方式
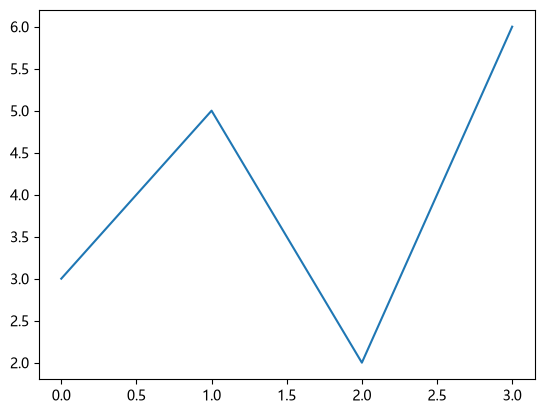
1.只传入y
当只提供一个序列时,matplotlib会自动生成横坐标(从0开始)
Python1 行
plt.plot([3,5,2,6])点击查看
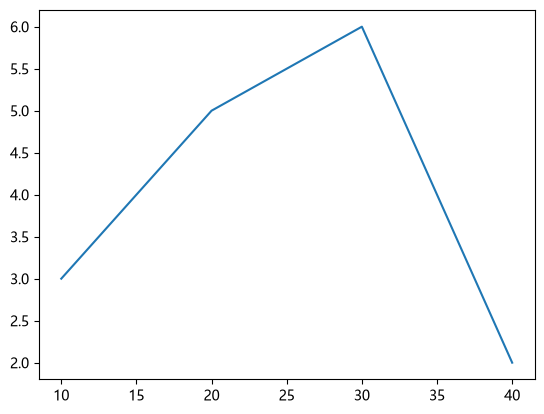
2.传入x和y
Python3 行
x = [10,20,30,40]
y = [3,5,6,2]
plt.plot(x,y)
点击查看
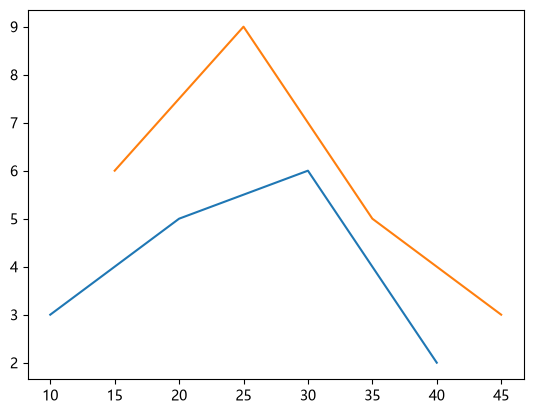
3.传入多组数据
Python5 行
x1 = [10,20,30,40]
x2 = [15,25,35,45]
y1 = [3,5,6,2]
y2 = [6,9,5,3]
plt.plot(x1,y1,x2,y2)
点击查看
颜色样式与数据点
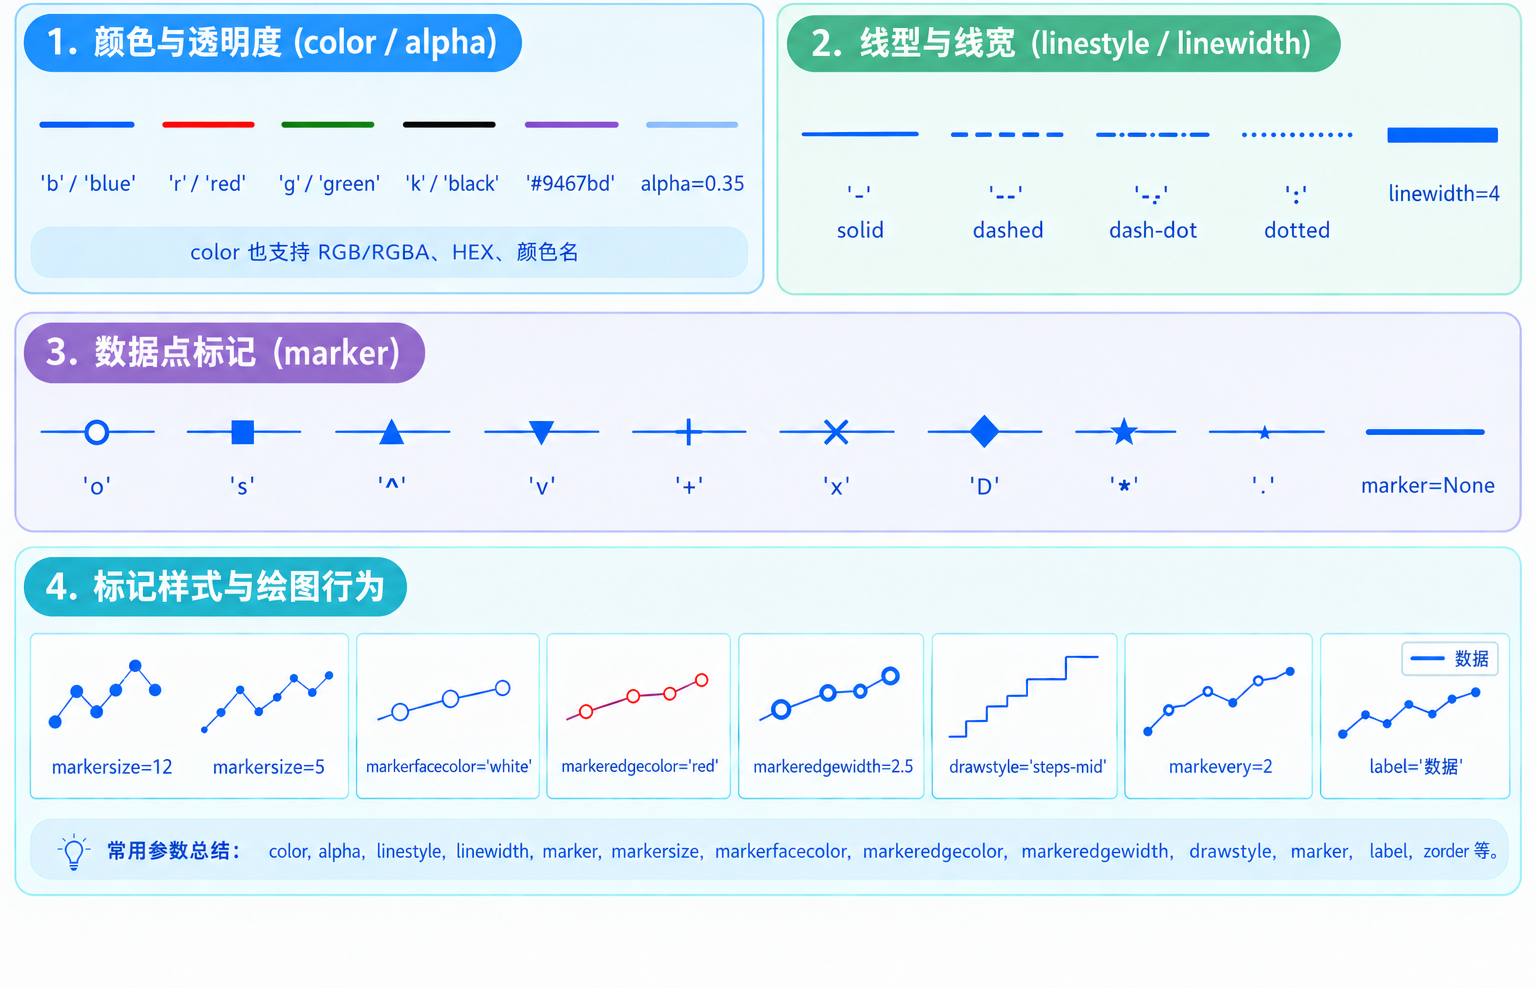 可以使用
fmt 格式字符串,它可以用一个字符串同时指定标记、线型和颜色。
Python4 行
plt.plot(
    x, y1, 'r-o',
    x, y2, 'b--s'
)
其中:
'r-o':红色实线,圆形标记。'b--s':蓝色虚线,方形标记。 也可以不用fmt,而是使用关键字参数:
Python2 行
plt.plot(x, y1, color='red', linestyle='-', marker='o')
plt.plot(x, y2, color='blue', linestyle='--', marker='s')
fmt 和关键字参数同时存在时,关键字参数优先级更高。
Python1 行
ax.plot(x, y, 'ro--', color='blue') # 最终是蓝色,不是红色