文章Matplotlib第 5 章
条形图与水平条形图
Matplotlib · 第 5 / 43 章
垂直条形图 bar()
Python1 行
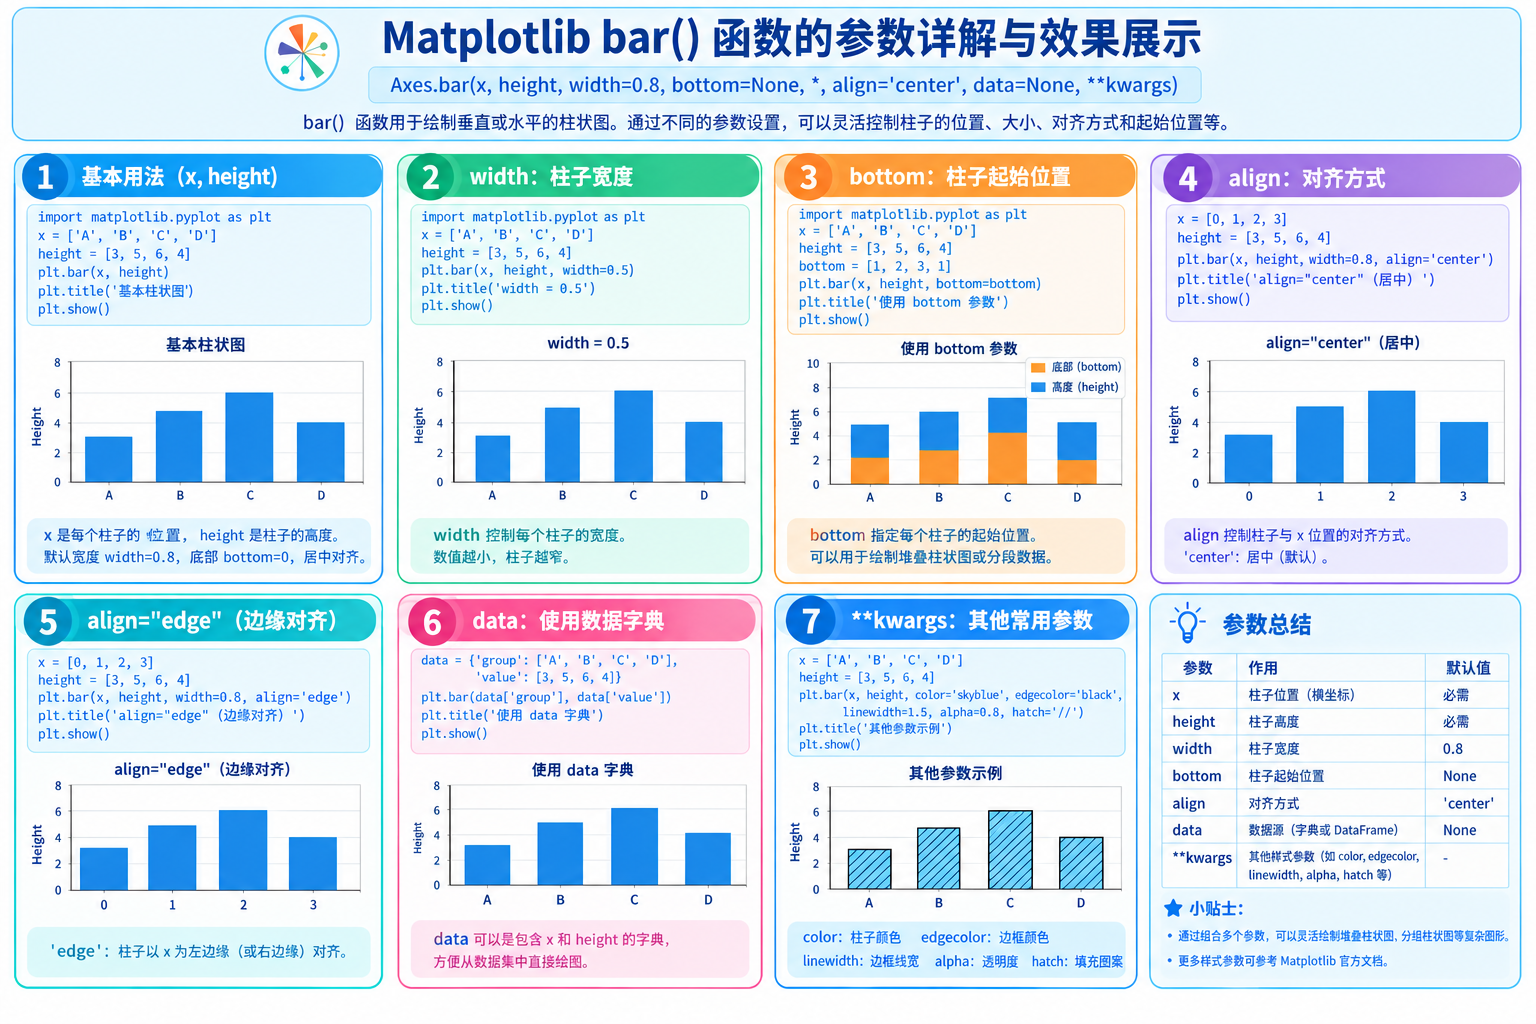
Axes.bar(self, x, height, width=0.8, bottom=None, *, align='center', data=None, **kwargs)| 参数 | 含义 | 说明 |
|---|---|---|
x |
柱子的中心位置 | 数值坐标;类别标签靠 set_xticks 贴 |
height |
柱高 | 数组,长度须与 x 一致 |
width |
柱宽 | 默认 0.8;分组时用 width=0.4 之类留出空隙 |
bottom |
柱底位置 | 堆叠就靠它累积;默认 0 |
align |
对齐方式 | "center"(默认,x 是中心)/ "edge"(x 是左边界) |
color / facecolor |
填充色 | 可传颜色列表逐柱上色 |
edgecolor |
边框色 | 白色最常用(把相邻柱分开) |
linewidth |
边框宽 | 0.5~1.0 |
label |
图例文字 | 配合 ax.legend() |
yerr |
误差棒 | 可直接画柱状误差,等价于再调 errorbar |
log |
对数纵轴 | True 时用对数刻度 |
Python8 行
import matplotlib.pyplot as plt

categories = ['A', 'B', 'C', 'D']
values = [3, 7, 5, 9]

fig, ax = plt.subplots()
ax.bar(categories, values)
plt.show()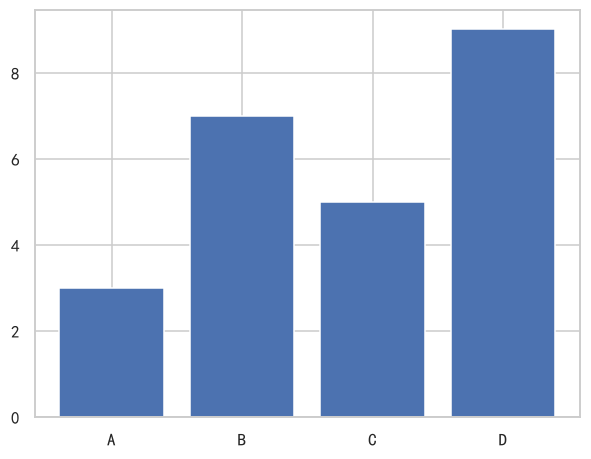
参数说明
水平条形图barh()
类别名较长时的首选(横着放不用旋转标签)。也是排行榜图形的标准形式, 参数和bar()类似。
Axes.barh(self, y, width, height=0.8, left=None, *, align='center', data=None, **kwargs)| 参数 | 含义 | 说明 |
|---|---|---|
y |
条的中心位置 | 数值坐标 |
width |
条的长度(对应 bar 的 height) | 数组 |
height |
条的粗细(对应 bar 的 width) | 默认 0.8,成对画时用 0.3~0.4 |
left |
条左端位置 | 对应 bar 的 bottom,用于水平堆叠 |
align |
"center" / "edge" |
"edge" 时 y 是条的下边界 |
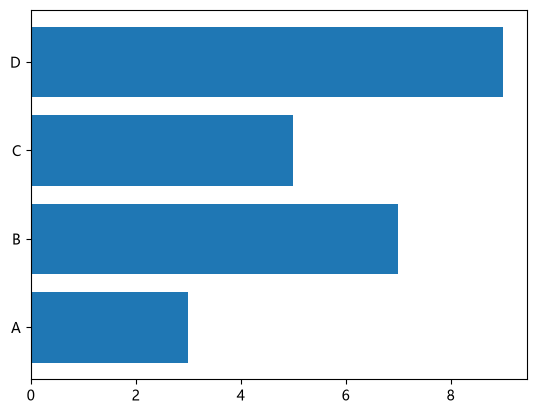
Python8 行
import matplotlib.pyplot as plt

categories = ['A', 'B', 'C', 'D']
values = [3, 7, 5, 9]

fig, ax = plt.subplots()
ax.barh(categories, values)
plt.show()