目录12
文章Matplotlib第 7 章
直方图
Matplotlib · 第 7 / 43 章
直方图(一维分布)hist()
hist() 干三件事:分箱 → 计数 → 画柱子。它同时是一个统计工具和一个绘图工具,所以参数分两类:一类决定「怎么分箱」(bins range weights),一类决定「怎么画」(histtype density cumulative rwidth)。
Axes.hist(
    x,                    # 数据:一维数组,或多个数组组成的列表(一次画多组)
    bins=None,            # 箱数(int) / 边界数组 / "auto" 等字符串;None → rcParams["hist.bins"]=10
    range=None,           # (min, max) 统计范围,范围外的数据直接丢掉
    density=False,        # True 时纵轴是概率密度,总面积 = 1
    weights=None,         # 与 x 等长的权重数组,做加权计数
    cumulative=False,     # True 从左往右累加;-1 从右往左
    bottom=None,          # 柱子的起始高度,堆叠用
    histtype='bar',       # bar / barstacked / step / stepfilled
    align='mid',          # 箱边界与刻度对齐方式:mid / left / right
    orientation='vertical',  # vertical / horizontal
    rwidth=None,          # 柱宽占箱宽的比例,<1 会留缝
    log=False,            # 纵轴取对数
    color=None,           # 填充色
    label=None,           # 图例文字
    stacked=False,        # 多组数据时是否堆叠
    data=None,            # 允许 x 传列名(配 pandas)
    **kwargs              # 其余键传给每根柱子(Patch)
)| 参数 | 一句话 | 默认值的影响 |
|---|---|---|
bins |
分几箱 | 默认 10,数据量大时明显偏粗 |
range |
统计哪一段 | None 时用数据的最小最大值 |
density |
纵轴含义 | False 是计数,True 是密度(总面积 1) |
weights |
每点权重 | 默认等价于权重全 1 |
cumulative |
累积 | True 递增,-1 递减 |
histtype |
柱子形状 | "bar" 实心 |
orientation |
方向 | "vertical" |
rwidth |
柱宽 | None 时等于箱宽,柱间无缝 |
log |
对数纵轴 | 长尾数据必开 |
stacked |
多组堆叠 | 只有传多个数组时才有意义 |
最小示例
import numpy as np
import matplotlib.pyplot as plt

rng = np.random.default_rng(42)
data = rng.normal(0, 1, 2000)          # 2000 个标准正态样本
data_b = rng.normal(2, 1.2, 1200)      # 第二组,后面几节要用

fig, ax = plt.subplots()
ax.hist(data, bins=30)
plt.show()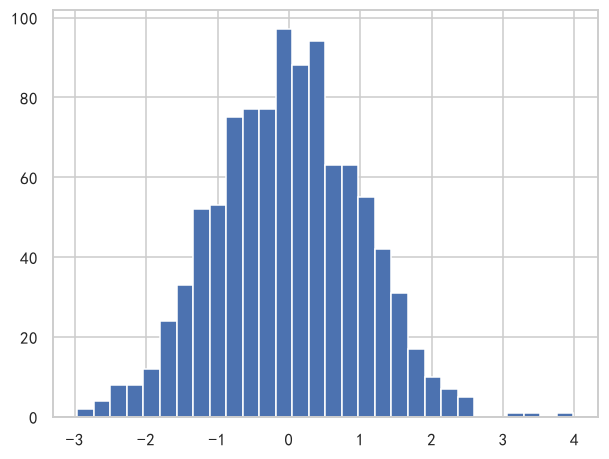
bins:形状由它决定
ax.hist(data, bins=5)                          # 太粗,双峰会被抹平成单峰
ax.hist(data, bins=10)                         # 默认值(rcParams["hist.bins"])
ax.hist(data, bins=30)                         # 常用
ax.hist(data, bins="auto")                     # 按数据量自动挑,最省事
ax.hist(data, bins=[-3, -1, 0, 1, 3])          # 自己给边界(可不等宽)
ax.hist(data, bins=np.arange(-4, 4.5, 0.5))    # 等宽边界的写法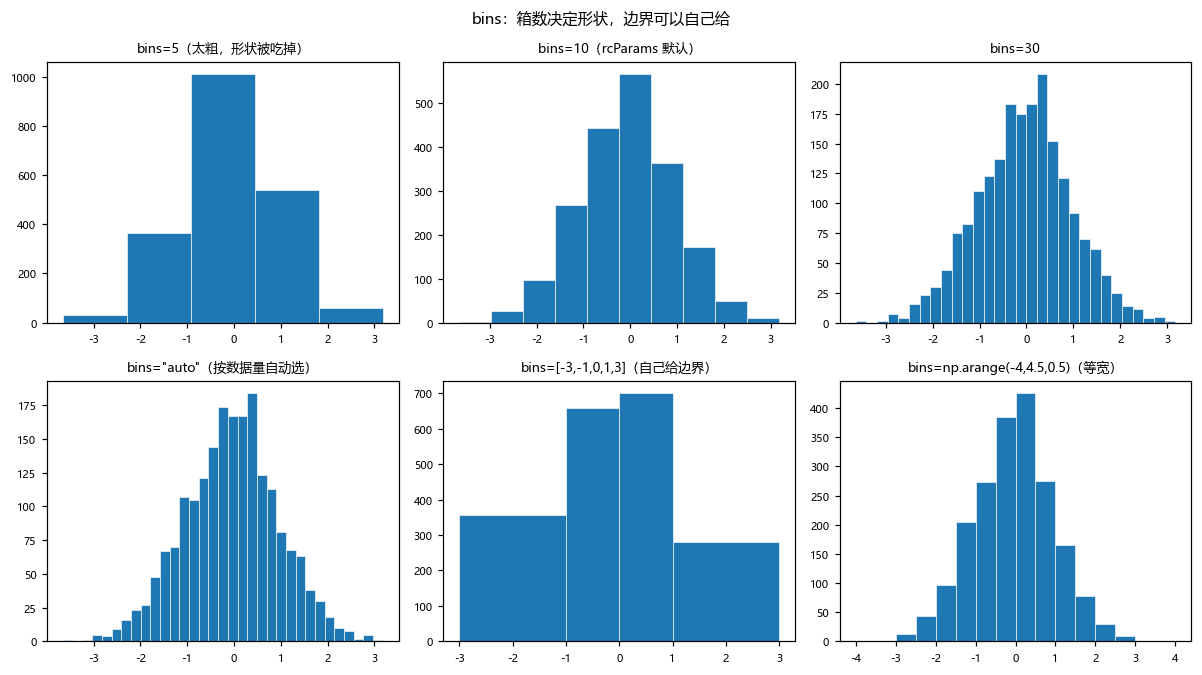
三种给法各自的适用场景:
| 写法 | 什么时候用 |
|---|---|
bins=30 |
数据量几千,随手看分布 |
bins="auto" |
不确定该给多少,让 matplotlib 按 Freedman–Diaconis 规则算 |
bins=[边界数组] |
要固定箱宽做跨图对比,或者故意不等宽分箱 |
跨图对比时必须固定边界。 两张图各自 bins=30,箱子边界并不一样,柱子高度无法直接比。要对比就共用一个 edges:
edges = np.linspace(-4, 4, 33)
ax.hist(data, bins=edges, alpha=0.6)
ax.hist(data_b, bins=edges, alpha=0.6)
range:先砍数据,再分箱
ax.hist(data, bins=30, range=(-2, 2))range 之外的数据直接丢弃,不参与计数,也不会在图上留空箱。所以它既是「剔除极值影响」的手段,也是「两图共用同一坐标系」的技巧——配合同一组 bins 使用。
注意 range 与 bins 的边界会互相影响:给了 bins=[-3,-1,0,1,3] 又给 range=(-2,2),实际生效的是 bins 的边界。
density:纵轴换成密度
ax.hist(data, bins=30)                      # 纵轴:计数(最高 200 左右)
ax.hist(data, bins=30, density=True)        # 纵轴:密度(总面积 = 1)

xs = np.linspace(-4, 4, 200)
ax.plot(xs, np.exp(-xs ** 2 / 2) / np.sqrt(2 * np.pi), "r-", lw=1.5)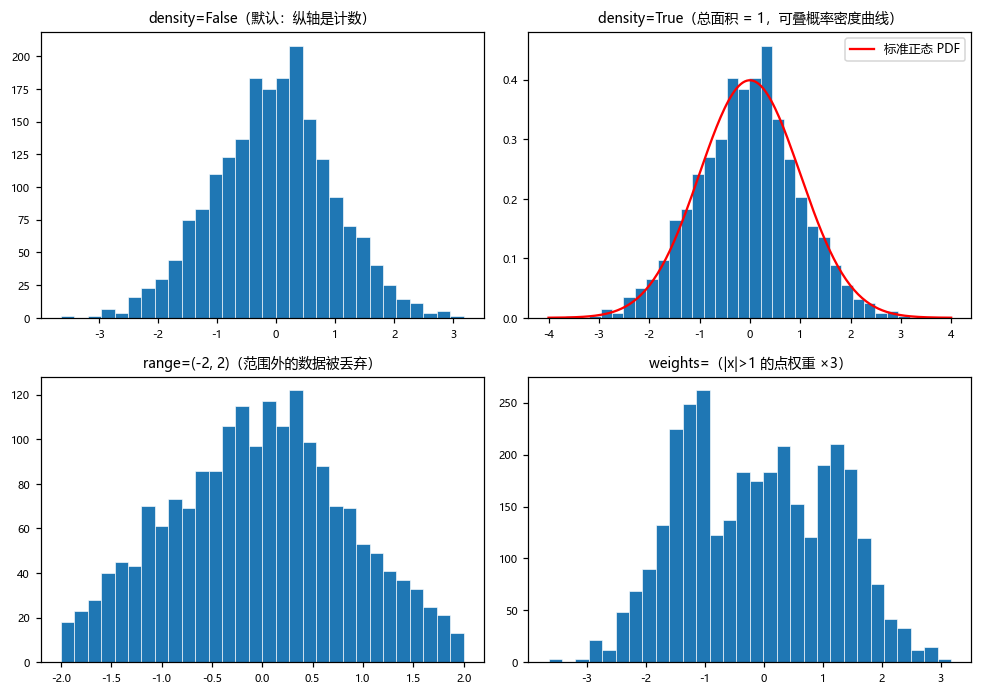
只有开了 density=True,直方图才能和概率密度曲线画在同一张图上——否则一个是「个数」一个是「密度」,量纲不同,曲线会被压成贴着 x 轴的一条线。
density=True 的效果是 sum(n * 箱宽) == 1,不是 sum(n) == 1。箱宽不同时,高箱不一定计数多。
weights:加权计数
w = np.where(np.abs(data) > 1, 3.0, 1.0)    # |x|>1 的点算 3 个
ax.hist(data, bins=30, weights=w)
weights 与 x 等长,默认全 1。常见用法:抽样权重、金额加权(每个点的「高度」是金额而不是笔数)。注意 density=True 时权重也会被归一进来,两者可以同用。
cumulative:累积分布
ax.hist(data, bins=30, cumulative=True)     # 从左往右累加,右端 = 总数
ax.hist(data, bins=30, cumulative=-1)       # 从右往左累,左端 = 总数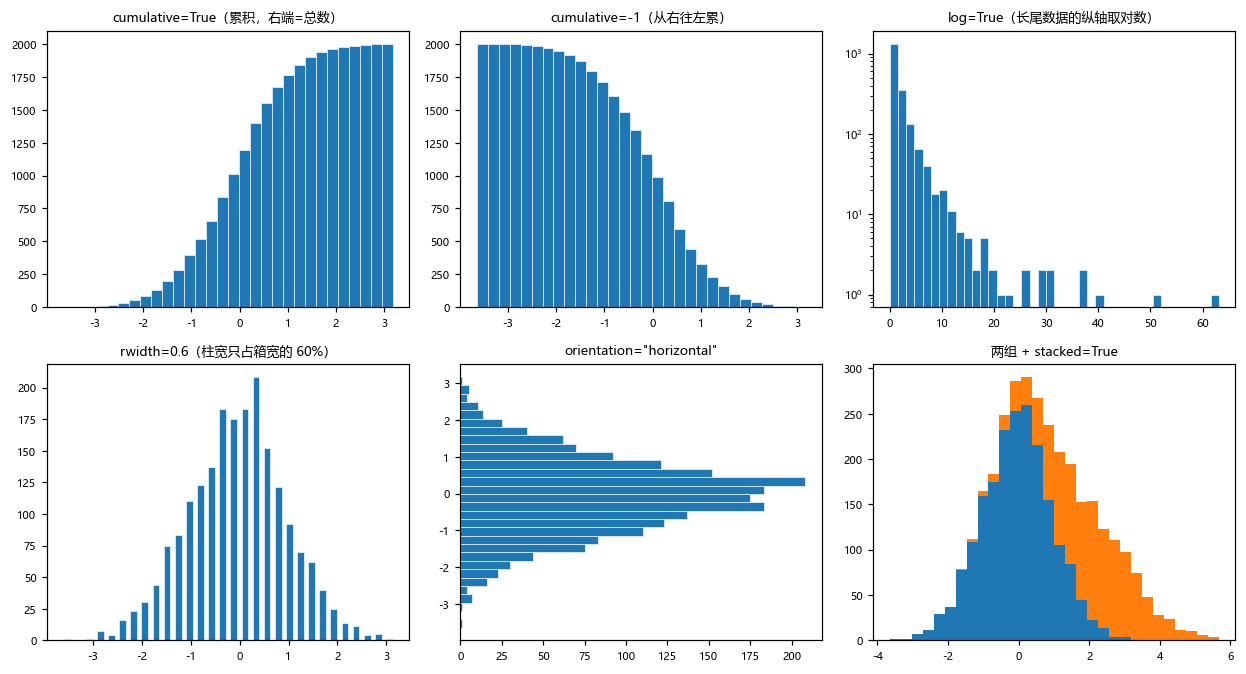
cumulative=True 的柱高是「小于等于当前箱右边界的数据个数」。想看中位数在哪,找柱高 = 总数一半的位置即可;cumulative=-1 则是「大于多少」,看尾部更直观。
想要真正平滑的累积曲线,ax.ecdf(data) 比 hist(cumulative=True) 更合适 —— 它直接画累积分布(complementary=True 就是反向累积,等价于 hist(cumulative=-1)),不用自己算箱。
histtype:四种柱形
ax.hist(data, bins=30, histtype="bar")            # 默认:实心柱
ax.hist([data, data_b], bins=30, histtype="barstacked")   # 堆叠柱
ax.hist(data, bins=30, histtype="step")           # 只有阶梯轮廓线
ax.hist(data, bins=30, histtype="stepfilled")     # 阶梯 + 填充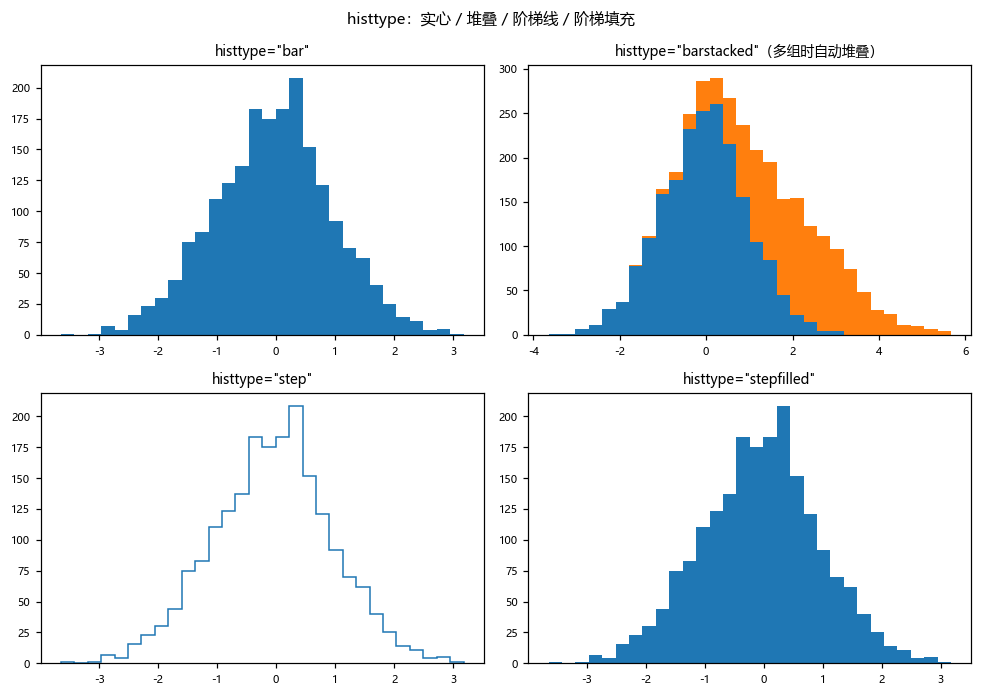
实际选择:
- 多组数据叠在一张图上,用
"step"。实心柱会互相遮挡,阶梯线才能看出各自形状。 - 要显示构成比例,用
"barstacked"配多组数据(等价于stacked=True+histtype="bar")。 "stepfilled"适合单组数据,比"bar"干净。
orientation / rwidth / log
ax.hist(data, bins=30, orientation="horizontal")   # 横向直方图,x 轴变计数
ax.hist(data, bins=30, rwidth=0.6)                 # 柱宽只占箱宽 60%,柱间留缝
ax.hist(long_tail_data, bins=40, log=True)         # 长尾数据:纵轴取对数
log=True 值得单独记:长尾数据(如金额、访问量)用线性纵轴时,除了最高那根柱,其余全被压成一条线。取对数后尾部才看得见——但代价是「柱高的视觉比例」不再是真实比例,读图时要留心。
stacked 与 align
ax.hist([data, data_b], bins=30, stacked=True)     # 两组堆叠,总高度是两组之和

ax.hist(data, bins=30, align="mid")                # 默认:刻度在箱子中心
ax.hist(data, bins=30, align="left")               # 刻度在箱子左边界
ax.hist(data, bins=30, align="right")              # 刻度在箱子右边界
align 在单张图上看不出差别,但叠加密度曲线或竖线时会错半格。默认 "mid" 表示刻度落在箱子中心(即 (边界[i] + 边界[i+1]) / 2),而箱边界本身在 边界[i] 上。要在箱边界画竖线,就得用 align="left" 或者手动按边界算坐标。
返回的三元组
hist() 返回 (n, bins, patches):
n, bins, patches = ax.hist(data, bins=30)
# n       : 每箱计数,dtype 恒为 float(即使没做归一化)
# bins    : 箱边界,长度 = 箱数 + 1
# patches : BarContainer,可迭代取每根柱子改样式

print(n.sum())                  # == len(data)(没设 range/weights 时)
print(np.diff(bins))            # 各箱宽度
for patch, count in zip(patches, n):
patch.set_alpha(count / n.max()) # 按计数调透明度拿到 n 和 bins 就能做二次加工:找众数所在箱、标注峰顶、把计数写回图里。
注意事项
bins默认只有 10。 数据量上千时必须显式给,否则形状不可信。n的 dtype 是 float,n.sum()与len(data)相等但不一定是整数类型。- 跨图对比要共用
edges。 各自bins=30的箱边界互不相同。 density=True满足的是sum(n * width) == 1,不是sum(n) == 1。range之外的数据被丢弃,不报错。- 多组数据用
histtype="step",否则实心柱互相遮挡。 align影响刻度与箱边界的对齐,叠加竖线时要留意半格偏移。