目录10
文章Matplotlib第 12 章
事件图
Matplotlib · 第 12 / 43 章
事件图(光栅图)eventplot()
事件图的数据只有「时刻」,没有「数值」——每个事件画成一根短线,多组事件堆成若干行,就是神经科学里的 raster plot。常见用途:放电时刻、用户点击时间、任务起止、设备报障时间。
Axes.eventplot(
    positions,              # 事件位置:一维数组(单行)或「列表的列表」(多行)
    orientation="horizontal",  # horizontal:事件线竖直、组沿 y 堆叠
    lineoffsets=1,          # 第 i 行的偏移 = i × lineoffsets(★ 是乘不是加)
    linelengths=1,          # 每根线的长度(垂直于事件轴)
    linewidths=None,        # 线宽,一组一个
    colors=None,            # 颜色:一个 / 每组一个
    linestyles="solid",     # 线型
    alpha=None,             # 透明度,重叠密集时用
    **kwargs                # 其余传给 EventCollection
)| 参数 | 一句话 | 默认值的影响 |
|---|---|---|
positions |
事件位置 | 一维 → 自动包成一行;列表 → 每组一行 |
lineoffsets |
行偏移 | 标量时第 i 行在 i × lineoffsets,首行在 0 |
linelengths |
线长 | 1;与行间距相等时相邻行首尾相接 |
linewidths |
线宽 | 一组一个,不能逐根 |
colors |
颜色 | 一个色 / 每组一个色 |
linestyles |
线型 | "solid" |
alpha |
透明度 | 密集重叠必须调 |
orientation |
朝向 | "horizontal":事件线竖直 |
一维数组 vs 列表的列表
events = [np.sort(rng.random(20)) + i * 0.1 for i in range(3)]   # 3 组,各 20 个时刻

fig, ax = plt.subplots()
ax.eventplot(events)
plt.show()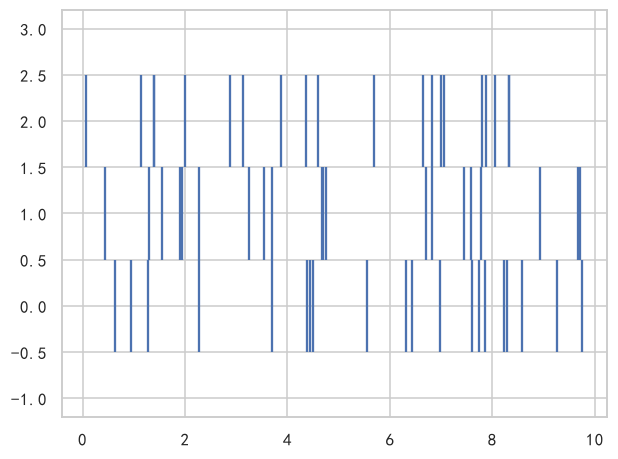
一维数组会被自动包成一层,得到单行:
print(len(ax.eventplot(rng.random(30))))
# 输出: 1

print(len(ax.eventplot(events)))
# 输出: 3
返回值是 list[EventCollection],长度 = 组数。这个细节决定了配色和改样式的粒度——一个 EventCollection 管一整行。
lineoffsets:行间距是乘出来的
这是最容易误解的参数。标量 lineoffsets 不是「相邻行的间距」,而是「单位偏移」,第 i 行(从 0 数)落在 i × lineoffsets:
ecs = ax.eventplot(events)                          # lineoffsets=1(默认)
print([float(c.get_lineoffset()) for c in ecs])
# 输出: [0.0, 1.0, 2.0]

ecs = ax.eventplot(events, lineoffsets=5)
print([float(c.get_lineoffset()) for c in ecs])
# 输出: [0.0, 5.0, 10.0]两个坑:首行永远在 0(不是 1、也不是 lineoffsets);给 5 得到的是 0/5/10,不是 5/10/15。想要精确位置就传数组:
ecs = ax.eventplot(events, lineoffsets=[1, 2.5, 4])
print([float(c.get_lineoffset()) for c in ecs])
# 输出: [1.0, 2.5, 4.0]linelengths:线有多长
ax.eventplot(events, lineoffsets=1, linelengths=1)     # 默认:相邻行首尾相接
ax.eventplot(events, lineoffsets=1, linelengths=0.6)   # 留缝,行与行分明
ax.eventplot(events, lineoffsets=0.5, linelengths=1)   # 线长 > 行距 → 上下粘连
线以行偏移为中心、往两边各伸 linelengths / 2。所以「不粘连」的条件是 linelengths <= 行距——行距由 lineoffsets 决定,两个参数必须一起调,只改一个必然出问题。
linewidths:只能一组一个
ax.eventplot(events, linewidths=[0.5, 1.5, 3]) # 3 组 → 3 个值长度对不上直接报错:
ax.eventplot(events[0], linewidths=np.linspace(0.5, 3, 20))
# ValueError: linewidths and positions are unequal sized sequences
明明有 20 根线,为什么给 20 个宽度还报错?因为 eventplot 把 linewidths 按组广播,此时只有 1 组,20 个值就对不上了。要逐根不同,画完再对 EventCollection 动手:
ecs = ax.eventplot(events[0])
ecs[0].set_linewidths(np.linspace(0.5, 3, 20))     # LineCollection 的方法,逐段生效
plt.show()colors:一个色 / 每组一个色
ax.eventplot(events, colors="black")                              # 全部同色
ax.eventplot(events, colors=["#1f77b4", "#ff7f0e", "#2ca02c"])    # 每组一色
长度必须等于组数,否则:
ax.eventplot([events[0], events[1]], colors=["#1f77b4", "#ff7f0e", "#2ca02c"])
# ValueError: colors and positions are unequal sized sequences配色常用来编码第三个维度:比如每组是一台设备,颜色表示设备所属车间。
orientation:谁都朝哪
ax.eventplot(events, orientation="horizontal", lineoffsets=[1, 2, 3])  # 默认
ax.eventplot(events, orientation="vertical", lineoffsets=[1, 2, 3])"horizontal":事件沿 x 轴分布,每根线竖直,组沿 y 轴堆叠(时间在横轴,最常用)。"vertical":事件沿 y 轴分布,每根线水平,组沿 x 轴排开。
两种朝向的 lineoffsets 都从 0 起算、步长按上面的乘法规则走。
linestyles / alpha
ax.eventplot(events, linestyles="dashed", alpha=0.6)alpha 不是装饰:事件图的数据量一大,相邻事件线会重叠成色块,调低透明度才看得出密度。以密度看趋势时比加 hist 更直观。
返回对象
ecs = ax.eventplot(events)
print(len(ecs), type(ecs[0]).__name__)
# 输出: 3 EventCollection

print(len(ecs[0].get_segments()))          # 一行 20 个事件 → 20 段
# 输出: 20

ecs[0].set_color("#C44E52")
ecs[0].set_linelength(0.5)
ecs[1].set_lineoffset(3)
ecs[1].set_linewidth(2)
plt.show()EventCollection 是 LineCollection 的子类,所以 set_color / set_linewidth / set_segments 这些方法都能用;set_linelength / set_lineoffset 是它自己加的,只对整行生效。
注意事项
lineoffsets标量是乘法:第 i 行在i × lineoffsets,首行在 0。linelengths要和lineoffsets配套,单独调一个必然粘连或断得过开。linewidths按组广播,想逐根不同得对EventCollection调set_linewidths。colors长度必须等于组数,一维positions就是 1 组。- 一维数组会被自动包一层——想让 20 个时刻变成 20 行,得写
[[t] for t in times]。 - 事件图只有瞬时时刻,表达不了持续时间。有起止时间请用
broken_barh()或barh。 - 线数上万时会明显变慢,先降采样或改用
hist。
综合示例:多设备故障时刻
import numpy as np
import matplotlib.pyplot as plt

plt.rcParams["font.sans-serif"] = ["SimHei", "Microsoft YaHei", "DejaVu Sans"]
plt.rcParams["axes.unicode_minus"] = False

rng = np.random.default_rng(3)
devices = ["路由器", "交换机", "防火墙", "服务器"]

fig, axes = plt.subplots(1, 2, figsize=(14, 4.2))

# ---- (a) 四台设备的报障时刻,颜色编码车间 ----
faults = [np.sort(rng.uniform(0, 24, 25)) for _ in devices]
axes[0].eventplot(faults, lineoffsets=[0, 1, 2, 3], linelengths=0.7,
                  linewidths=1.2, colors=["#4C72B0"] * 4, alpha=0.9)
axes[0].set_yticks([0, 1, 2, 3], devices)
axes[0].set_xlim(0, 24)
axes[0].set_xticks(range(0, 25, 4), [f"{h}:00" for h in range(0, 25, 4)])
axes[0].set_xlabel("一天中的时刻")
axes[0].set_title("(a) 报障时刻(一行一台设备)")

# ---- (b) 事件密度:同一份数据换成线宽编码强度 ----
dense = [np.sort(rng.normal(12, 3, 120)) for _ in devices]
for i, d in enumerate(dense):
    axes[1].eventplot(d, lineoffsets=i, linelengths=0.8, alpha=0.35,
                      linewidths=0.8, colors="#4C72B0")
axes[1].set_yticks([0, 1, 2, 3], devices)
axes[1].set_xlim(0, 24)
axes[1].set_xlabel("一天中的时刻")
axes[1].set_title("(b) 120 个事件:靠 alpha 看密度")

plt.tight_layout()
plt.show()(b) 是事件图的正确读法:单根线没有意义,一堆线聚成一条深色的带才是信息——那条带就是「故障集中在 12 点前后」。