目录8
文章Matplotlib第 13 章
火柴杆图
Matplotlib · 第 13 / 43 章
火柴杆图 stem()
stem() 是「离散信号的 plot()」:每个点一根从基线竖起的杆 + 一个端点标记。它明确表示中间没有值,所以只适合短序列——单位脉冲响应、离散概率分布、FFT 前十几项、逐帧计数这类十几个到几十个采样点。
Axes.stem(
    *args,                  # (y,) 或 (x, y),同 plot 的位置参数约定
    linefmt=None,           # 杆的格式串,如 "C1-"(默认 "C0-")
    markerfmt=None,         # 端点的格式串,如 "C1o"(默认 "C0o")
    basefmt=None,           # 基线的格式串,默认 "C3-"(★ 红色实线)
    bottom=0,               # 基线位置,杆从 bottom 长到 y
    label=None,             # 图例文字(只打在端点线上)
    orientation="vertical", # "vertical" / "horizontal"
)| 参数 | 一句话 | 默认值的影响 |
|---|---|---|
*args |
(y,) 或 (x, y) |
只给 y 时 locs = 0, 1, 2… |
linefmt |
杆的格式串 | "C0-" 蓝色实线 |
markerfmt |
端点格式串 | "C0o";不写标记则端点消失 |
basefmt |
基线格式串 | "C3-"(红色),最容易被当成 bug |
bottom |
基线高度 | 0;改了杆就从别处长出来 |
orientation |
朝向 | "vertical" |
label |
图例名 | 只在 markerline 上生效 |
*args:一个数组还是两个
x = np.arange(12)
y = np.array([0, 2, 1, 4, 3, 6, 2, 5, 4, 7, 3, 6], dtype=float)

fig, ax = plt.subplots()
ax.stem(x, y)
plt.show()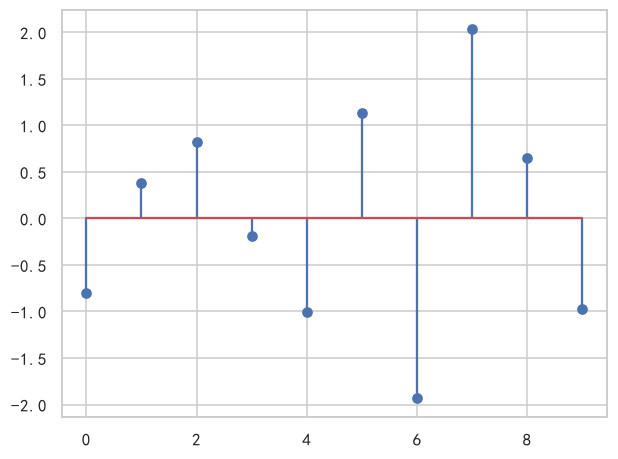
只给一个数组时,它被当成 heads,locs 自动补成 0, 1, 2...:
st = ax.stem(y)
print(st.markerline.get_xdata())
# 输出: [ 0  1  2  3  4  5  6  7  8  9 10 11]
这和 plot(y) 的约定一致:位置参数个数决定了谁是横轴。
linefmt / markerfmt:杆和端点各写各的
格式串规则和 plot 完全一样:[颜色][线型][标记],两部分各自独立。
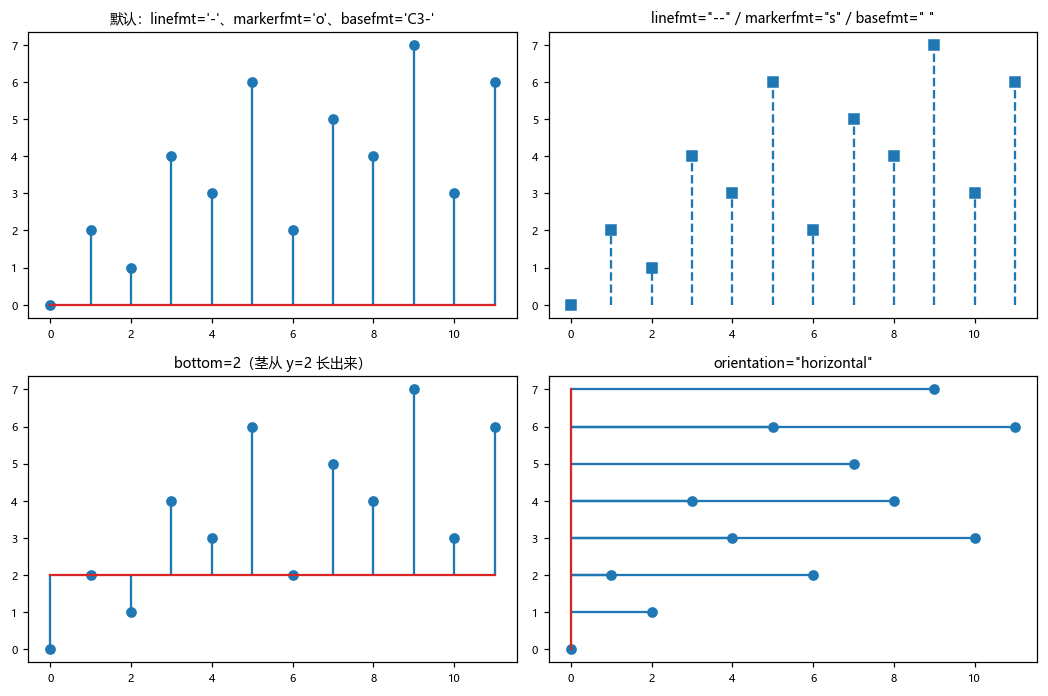
ax.stem(x, y, linefmt="--",  markerfmt="s")      # 杆虚线、端点方块
ax.stem(x, y, linefmt="C1-", markerfmt="C1o")    # 换成橙色,杆/点同色
ax.stem(x, y, linefmt=":",   markerfmt="D")      # 点线 + 菱形
linefmt="C1" 只给颜色也是实线——不写线型不等于不画线:
st = ax.stem(x, y, linefmt="C1")
print(st.stemlines.get_linestyle())
# 输出: [(np.float64(0.0), None)] ← None 表示实线basefmt:默认那条红线
第一次画 stem 的人几乎都会问「这条红色横线哪来的」——它是 basefmt 的默认值 "C3-",C3 是红色。
ax.stem(x, y)                                    # 默认:基线 C3 红色实线
ax.stem(x, y, basefmt=" ")                       # 一个空格 → 基线不画
ax.stem(x, y, basefmt="k-", linefmt="C0--")      # 黑色细基线,杆用虚线
" "(一个空格)不是「透明」也不是「白色」,是把线型设成 None——线对象还在,但不渲染:
st = ax.stem(x, y, basefmt=" ")
print(st.baseline.get_linestyle())
# 输出: Nonebottom:基线不在 0
st = ax.stem(x, y, bottom=2)
print(st.stemlines.get_segments()[0].round(2).tolist())
# 输出: [[0.0, 2.0], [0.0, 0.0]]
每段是 [[x, bottom], [x, y]]:杆从 bottom 出发长到 y。第一个点是 y=0,而 bottom=2,所以这根杆朝下长。bottom 不是「裁剪起点」而是「所有杆的共同原点」,这点和 bar 的 bottom 语义不同。
orientation:只交换谁在横轴
ax.stem(x, y, orientation="horizontal")参数顺序不变——第一个仍是 locs,第二个仍是 heads,只是画的时候对调:
st = ax.stem(x, y, orientation="horizontal")
print(st.markerline.get_xdata()[:4])     # heads → 横轴
# 输出: [0. 2. 1. 4.]

print(st.markerline.get_ydata()[:4])     # locs → 纵轴
# 输出: [0 1 2 3]
所以 stem(y, x, orientation="horizontal") 和 stem(x, y, orientation="horizontal") 是两张完全不同的图——orientation 不改变参数含义,只改变落笔方向。
返回对象
markerline, stemlines, baseline = ax.stem(x, y)     # 位置解包,顺序固定
# markerline : Line2D        端点
# stemlines  : LineCollection 所有杆(★ 一条对象管全部)
# baseline   : Line2D        基线

print(type(markerline).__name__, type(stemlines).__name__, type(baseline).__name__)
# 输出: Line2D LineCollection Line2D所有杆共用一条 LineCollection,所以改杆的样式一把全改,不存在「第 3 根杆」这种对象:
markerline, stemlines, baseline = ax.stem(x, y)

markerline.set_markersize(8)
markerline.set_markerfacecolor("white")
stemlines.set_linewidth(2)          # 一次性改所有杆
baseline.set_linestyle("--")
baseline.set_color("gray")
plt.show()也可以按属性名访问,StemContainer 的三个实例属性就是这三个对象:
st = ax.stem(x, y, label="采样值")
st.markerline.set_color("red")
st.stemlines.set_alpha(0.6)
st.baseline.set_linewidth(0.5)
ax.legend()                         # label 落在 markerline 上,只出一个标记点
print(st.get_label())
# 输出: 采样值
plt.show()注意事项
basefmt默认"C3-",那条红线是默认值不是 bug。basefmt=" "是把线型设成None,线对象仍存在,get_children()里还能看到。stemlines是一个LineCollection,没有「第 n 根杆」这个对象。bottom是所有杆的共同原点,不为 0 时杆可能朝下长。- 只传
y时locs从 0 开始。 label只挂在markerline上,图例里显示的是孤零零一个标记点,没有杆。- 点数超过一两百就改用
plot或bar——杆会糊成一片,stem的「离散」语义也没了。
综合示例:默认 / 自定义样式 / 离散概率分布
import numpy as np
import matplotlib.pyplot as plt

plt.rcParams["font.sans-serif"] = ["SimHei", "Microsoft YaHei", "DejaVu Sans"]
plt.rcParams["axes.unicode_minus"] = False

rng = np.random.default_rng(11)
n = np.arange(10)
counts = rng.poisson(3, 10)

fig, axes = plt.subplots(1, 3, figsize=(15, 4.2))

# ---- (a) 默认:能看到 C3 红基线 ----
axes[0].stem(n, counts)
axes[0].set_title("(a) 默认(红线是 basefmt='C3-')")

# ---- (b) 全自定义:隐藏基线、白心圆点、加粗杆 ----
st = axes[1].stem(n, counts, linefmt="C0--", markerfmt="o", basefmt=" ")
st.markerline.set_markerfacecolor("white")
st.markerline.set_markeredgewidth(1.4)
st.stemlines.set_linewidth(1.6)
axes[1].axhline(0, color="gray", linewidth=0.8, zorder=0)   # 自己画一条低调的基线
axes[1].set_title("(b) basefmt=' ' + 自绘基线")

# ---- (c) 离散分布 + bottom:概率质量函数的样子 ----
k = np.arange(8)
pmf = np.exp(-2.5) * 2.5 ** k / np.array([1, 1, 2, 6, 24, 120, 720, 5040])
axes[2].stem(k, pmf, linefmt="C4-", markerfmt="C4o", basefmt="C7-")
axes[2].set_xlabel("k")
axes[2].set_ylabel("P(X = k)")
axes[2].set_title("(c) 泊松 PMF:stem 的典型用途")

plt.tight_layout()
plt.show()(c) 才是 stem 真正的主场:概率质量函数在整数点上有值、别处没有,画成柱子会给人「区间内有量」的错觉,stem 不会。