目录6
文章Matplotlib第 15 章
阶梯图
Matplotlib · 第 15 / 43 章
step() —— 阶梯图
step() 的数据和 plot() 完全一样,差别只在怎么连线:plot 在相邻点之间画斜线,暗示「中间是连续过渡」;step 画水平和垂直两段,明确表示「值在某处瞬间跳变」。凡是本质离散的量——计数、状态、累积分布——都该用它。
Python7 行
Axes.step(
    x, y,          # 位置参数,同 plot
    *args,         # 格式串,如 "r--"
    where="pre",   # ★ 跳变位置:pre / post / mid
    data=None,
    **kwargs
)| 参数 | 一句话 | 默认值的影响 |
|---|---|---|
x / y |
数据 | 同 plot,x 须单调递增 |
*args |
格式串 | 同 plot |
where |
跳变落点 | "pre";画直方图轮廓应该用 "post" |
**kwargs |
Line2D 属性 |
linewidth / color / marker 都行 |
where:把 y[i] 理解成「哪个区间的高度」
Python9 行
import numpy as np
import matplotlib.pyplot as plt

x = np.arange(0, 10)
y = np.random.randint(1, 5, 10)

fig, ax = plt.subplots()
ax.step(x, y)
plt.show()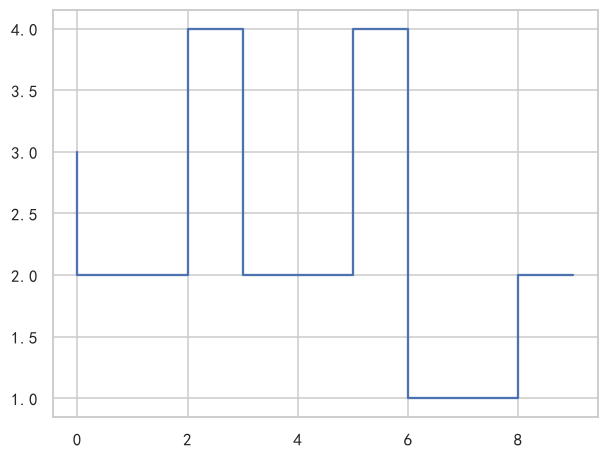
三种取值的区别可以用一句话概括:y[i] 从哪个 x 开始生效。
Python3 行
ax.step(x, y, where="pre")     # y[i] 管 [x[i-1], x[i]]  → 跳变在 x[i] 左边
ax.step(x, y, where="post")    # y[i] 管 [x[i], x[i+1]]  → 跳变在 x[i] 右边
ax.step(x, y, where="mid")     # 跳变落在相邻 x 的中点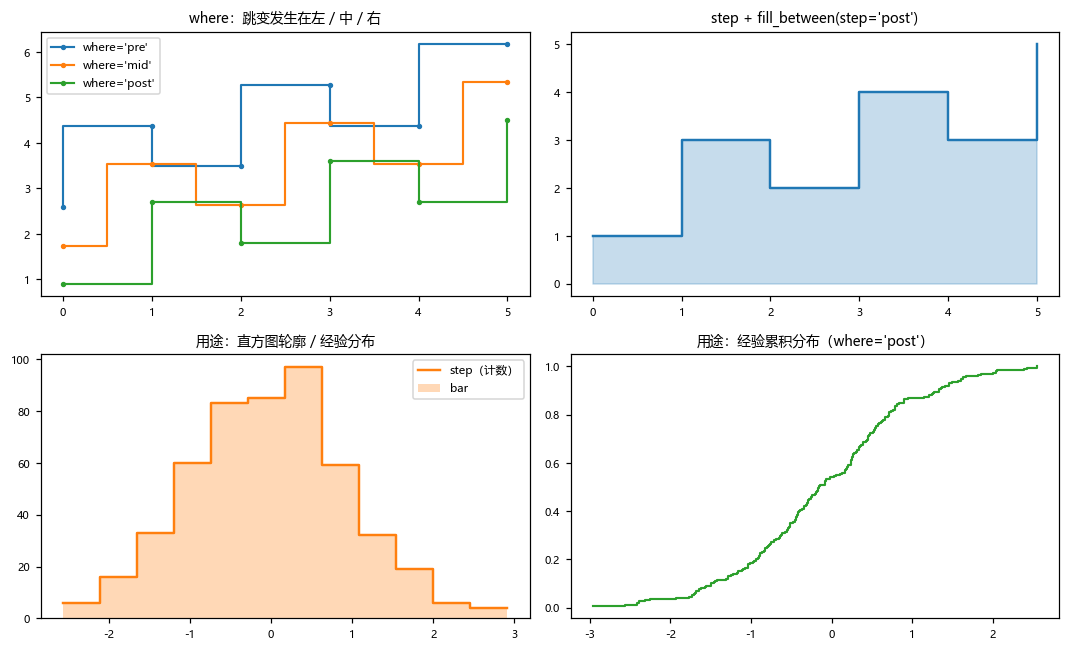
判据很实用:画直方图轮廓、经验分布用 post——因为「计数属于这个 bin 的区间」意味着台阶应该从 bin 的左边界开始。用默认的 pre 会让整条轮廓左移一格,是最常见的「图对不上数据」。
fill_between 的 step 必须与 where 一致
Python2 行
ax.step(x, y, where="post")
ax.fill_between(x, y, step="post", alpha=0.25)     # ★ 同一个值
fill_between 有个同名的 step 参数,语义与 step() 的 where 完全相同。两处写得不一致,填充带就会比台阶错半格——图上看得出、代码里看不出来。
典型用途
Python2 行
hist, edges = np.histogram(rng.normal(0, 1, 500), bins=12)
ax.step(edges, np.append(hist, hist[-1]), where="post")   # 直方图轮廓
注意要 np.append(hist, hist[-1]):edges 有 n+1 个、hist 只有 n 个,补一个尾巴才能和最后一个 bin 的右边界对齐。
经验累积分布同理:
Python2 行
ecdf = np.sort(rng.normal(0, 1, 200))
ax.step(ecdf, np.arange(1, len(ecdf) + 1) / len(ecdf), where="post")
返回对象
Python7 行
lines = ax.step(x, y)          # list[Line2D],和 plot 一样
print(type(lines).__name__, len(lines))
# 输出: list 1

lines[0].set_linewidth(2.5)
lines[0].set_drawstyle("steps-pre")     # 也可以事后改台阶方式
plt.show()step 返回的就是 list[Line2D],没有专门的容器类。一次传多组 x, y 会返回多个 Line2D,line, = ax.step(x, y) 只在单组时成立。
注意事项
where默认"pre",画直方图轮廓几乎总要显式改成"post"。fill_between(step=...)和step(where=...)必须写同一个值。- x 必须单调递增;有重复 x 会得到一条竖直的「双层阶跃」。
- 台阶的竖直段是同一个 Line2D 里的线段,不是补出来的数据点,所以取
get_xdata()还是原来的长度。 - 想要「填充到下一级台阶」的效果用
fill_between(..., step="post"),不要自己拼坐标。
综合示例:直方图轮廓 / 状态切换 / 累积分布
Python41 行
import numpy as np
import matplotlib.pyplot as plt

plt.rcParams["font.sans-serif"] = ["SimHei", "Microsoft YaHei", "DejaVu Sans"]
plt.rcParams["axes.unicode_minus"] = False

rng = np.random.default_rng(21)
fig, axes = plt.subplots(1, 3, figsize=(15, 4.2))

# ---- (a) 直方图轮廓:post 才对得上 bin ----
data = rng.normal(0, 1, 600)
counts, edges = np.histogram(data, bins=14, range=(-3.5, 3.5))
axes[0].bar((edges[:-1] + edges[1:]) / 2, counts, width=np.diff(edges),
            color="#AEC7E8", edgecolor="white", label="bar")
axes[0].step(edges, np.append(counts, counts[-1]), where="post",
             color="#1f77b4", linewidth=1.8, label="step(post)")
axes[0].legend(fontsize=8)
axes[0].set_title("(a) 直方图轮廓")

# ---- (b) 状态切换:0/1 信号,斜线会骗人 ----
t = np.arange(0, 24)
state = np.array([0, 0, 1, 1, 1, 0, 0, 0, 1, 1, 1, 1,
                  0, 0, 1, 1, 0, 0, 0, 1, 1, 1, 0, 0])
axes[1].plot(t, state, color="gray", alpha=0.45, linewidth=1, label="plot(斜线)")
axes[1].step(t, state, where="post", color="#C44E52", linewidth=2, label="step(post)")
axes[1].set_yticks([0, 1], ["关", "开"])
axes[1].set_xlabel("小时")
axes[1].legend(fontsize=8, loc="center right")
axes[1].set_title("(b) 开关状态:step 才正确")

# ---- (c) 经验累积分布 ----
xs = np.sort(rng.normal(1.5, 1.0, 300))
ecdf = np.arange(1, len(xs) + 1) / len(xs)
axes[2].step(xs, ecdf, where="post", color="#55A868", linewidth=1.6)
axes[2].fill_between(xs, ecdf, step="post", color="#55A868", alpha=0.15)
axes[2].set_xlabel("x")
axes[2].set_ylabel("F(x)")
axes[2].set_title("(c) ECDF(where='post')+ 填充")

plt.tight_layout()
plt.show()(b) 是 step 存在的理由:plot 把「0 到 1 之间的中间值」画成了真实存在的过渡状态,而开关信号在那些时刻根本没有值。