目录9
文章Matplotlib第 23 章
等高线图
Matplotlib · 第 23 / 43 章
contour() / contourf() —— 等高线与填充等高线
两者画的是同一个东西——标量场 z = f(x, y) 的等值线——区别只在表现形式:contour 画线,contourf 填色块。地形图、气压场、损失函数曲面、双变量密度的二维直方轮廓都用它们。
Axes.contour(
    *args,               # (Z,) 或 (X, Y, Z)
    levels=None,         # ★ int(交给 MaxNLocator 挑刻度)或数组(精确指定)
    colors=None,         # 一色 / 逐级颜色列表;给了它 cmap 失效
    cmap=None,           # 按 levels 映射颜色
    linewidths=None,     # 标量或逐级列表
    linestyles=None,     # 'solid' / 'dashed' / 'dashdot' / 'dotted',或逐级列表
    alpha=None,
    extend="neither",    # 超出 levels 的部分怎么处理:both / min / max
    antialiased=None,
    nchunk=None,         # 分块计算,大网格省内存
    hatches=None,        # contourf 专用:逐级填充花纹
    norm=None,           # 如 LogNorm()
    vmin=None, vmax=None,
    data=None,
    **kwargs
)contourf 的参数与 contour 完全一致(多一个 hatches),只是输出从“一堆线”变成“一层层色块”。
| 参数 | 一句话 | 默认值的影响 |
|---|---|---|
levels |
分级 | None 自动选;传 int 只是“建议条数”,不是精确值 |
colors |
颜色 | 给了它 cmap 就失效 |
cmap |
颜色映射 | 按 levels 取值 |
linewidths / linestyles |
线宽 / 线型 | 可逐级给列表 |
extend |
两端怎么收 | 'neither':超出范围的值不着色 |
hatches |
填充花纹(contourf) |
黑白打印时靠它分层 |
nchunk |
分块 | 大网格(>1e7 点)才需要 |
最小示例
import numpy as np
import matplotlib.pyplot as plt

x = np.linspace(-3, 3, 160)
y = np.linspace(-3, 3, 140)
X, Y = np.meshgrid(x, y)
Z = (np.exp(-((X - 1) ** 2 + (Y - 1) ** 2) / 0.8) * 1.5
     + np.exp(-((X + 1) ** 2 + (Y + 0.8) ** 2) / 1.2) * 1.2
     + 0.4 * np.exp(-(X ** 2 + Y ** 2) / 3.0))

fig, ax = plt.subplots()
cs = ax.contour(X, Y, Z, levels=8, cmap="viridis")
ax.clabel(cs, inline=True, fmt="%.1f", fontsize=8)
plt.show()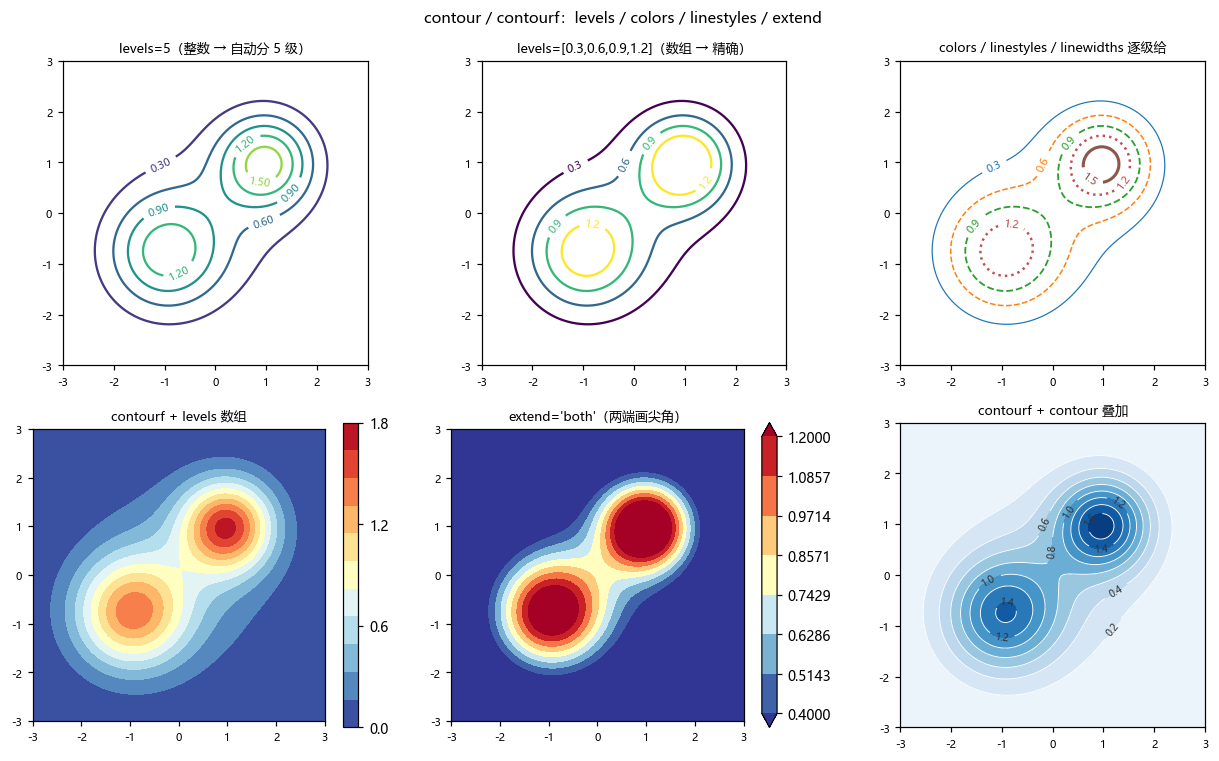
MeshGrid 的顺序容易记反:meshgrid(x, y) 返回的 X、Y 形状都是 (len(y), len(x))——行对应 y、列对应 x,和 imshow 的数组形状一致。
levels:整数不是“画 N 条线”
这是最反直觉的一处。传整数时 matplotlib 交给 MaxNLocator 去挑“好看的刻度”,实际级数会比你要的多:
levels=3  → 实际 5 级   [0.0, 0.25, 0.5, 0.75, 1.0]
levels=5  → 实际 6 级   [0.0, 0.2, 0.4, 0.6, 0.8, 1.0]
levels=10 → 实际 11 级  [0.0, 0.1, ..., 1.0]
levels=20 → 实际 21 级  [0.0, 0.05, ..., 1.0]
(实测于 1.0 峰值的高斯场;级数会随数据范围变,不能靠它做精确控制。)
要精确控制就传数组:
ax.contour(X, Y, Z, levels=[0.3, 0.6, 0.9, 1.2])          # 只画这 4 条
ax.contourf(X, Y, Z, levels=np.linspace(0, 1.8, 12))      # 12 级均匀
ax.contour(X, Y, Z, levels=[Z.max() * 0.5]) # 只画"半高线"只画一条特定等值线(比如半高线、阈值线)时,必须传单元素数组,不能传标量。
colors / linestyles / linewidths:逐级给
cs = ax.contour(X, Y, Z, levels=[0.3, 0.6, 0.9, 1.2, 1.5],
                colors=["#1f77b4", "#ff7f0e", "#2ca02c", "#C44E52", "#8c564b"],
                linestyles=["solid", "dashed", "dashed", "dotted", "solid"],
                linewidths=[0.8, 1.0, 1.2, 1.6, 2.0])
ax.clabel(cs, inline=True, fmt="%.1f", fontsize=7)三个参数都接受逐级列表,长度必须等于级数。这比 cmap 更好用的场景是「我想让某一条线特别突出」——cmap 只能给你连续的渐变,列表能精确指定第几条用什么。
给 colors 之后 cmap 完全失效,两者不叠加。
extend:两端怎么收
ax.contourf(X, Y, Z, levels=np.linspace(0.4, 1.2, 8), cmap="RdYlBu_r", extend="both")levels 只覆盖 [0.4, 1.2],但数据里有 0.02 和 1.8。默认 extend="neither" 时这些区域不着色(露出背景);"both" 会在色条两端加尖角三角形,表示“这里还有值”。
这是“为什么我的 contourf 图四周有一圈白”的标准答案。四个取值:'neither'(默认)、'both'、'min'、'max'。
clabel:把数值标在线上
cs = ax.contour(X, Y, Z, levels=8)
ax.clabel(cs, inline=True, fmt="%.1f", fontsize=8)
三个关键点:
inline=True会在数字处打断线条,避免文字压线和虚线交错——几乎总是要开。fmt接受格式串或字典:{0.3: "低", 1.2: "高"}可以给特定级贴文字标签。clabel是 Axes 的方法,第一个参数是contour返回的对象;不能对contourf用。
对数分级:跨数量级数据
Zl = 10 ** Z                                   # 值域跨几个数量级
ax.contourf(X, Y, Zl,
            levels=np.logspace(np.log10(Zl.min()), np.log10(Zl.max()), 15),
            cmap="magma")
线性 levels 在跨数量级数据上会把颜色全挤到一头——必须用 logspace 造分级。另一种写法是 norm=LogNorm() + 线性 levels,效果相近但色条刻度是对数轴。
返回对象
cs = ax.contour(X, Y, Z, levels=5)
print(type(cs).__name__)
# 输出: QuadContourSet

print(np.round(cs.levels, 2))
# 输出: [0.  0.3 0.6 0.9 1.2 1.5 1.8]

print(len(cs.get_paths()))
# 输出: 7

print(hasattr(cs, "collections"))
# 输出: Falsecs.levels→ 每级的数值数组(contourf也有)cs.get_paths()→ 几何路径。条数 ≠ 级数:一条等值线被数据截断成两段时,它是两条 pathcs.collections→ 3.10 已删除,老教程里的for c in cs.collections会直接AttributeError
cf = ax.contourf(X, Y, Z, levels=10)
fig.colorbar(cf, ax=ax)          # 直接传

# 想逐条改线型?在 contour() 里用列表一次给足,事后改没有对应对象了
plt.show()
QuadContourSet 在 3.10 之后不再持有一堆可单独操作的 Collection,这是从老版本迁过来最容易崩的地方。
注意事项
levels传整数只是“建议”,实际级数会多一两级(实测 3→5、5→6、10→11)。extend默认'neither',超出levels的区域不着色——“四周一圈白”就是它。colors给了以后cmap失效,两者不能叠加。clabel不能用于contourf的返回对象。cs.collections在 3.10 已删除,老代码要改成cs.get_paths()。get_paths()的条数不等于等值线级数,一条线可能断成多段。- 网格太密(几百万点)时
contour很慢,用nchunk分块或先降采样。 - 跨数量级的数据必须用对数
levels,否则颜色全挤在一端。
综合示例:线 + 填充 + 叠加
import numpy as np
import matplotlib.pyplot as plt

plt.rcParams["font.sans-serif"] = ["SimHei", "Microsoft YaHei", "DejaVu Sans"]
plt.rcParams["axes.unicode_minus"] = False

x = np.linspace(-3, 3, 160)
y = np.linspace(-3, 3, 140)
X, Y = np.meshgrid(x, y)
Z = (np.exp(-((X - 1) ** 2 + (Y - 1) ** 2) / 0.8) * 1.5
     + np.exp(-((X + 1) ** 2 + (Y + 0.8) ** 2) / 1.2) * 1.2
     + 0.4 * np.exp(-(X ** 2 + Y ** 2) / 3.0))

fig, axes = plt.subplots(1, 3, figsize=(16.5, 4.9))

# ---- (a) 只画线 + 标数值 ----
cs1 = axes[0].contour(X, Y, Z, levels=12, cmap="viridis", linewidths=1.2)
axes[0].clabel(cs1, inline=True, fmt="%.1f", fontsize=8)
axes[0].set_title("(a) contour(levels=12) + clabel")

# ---- (b) 填充 + 精确分级 + extend ----
cf = axes[1].contourf(X, Y, Z, levels=np.linspace(Z.min(), Z.max(), 20),
                      cmap="RdYlBu_r", extend="both", antialiased=True)
fig.colorbar(cf, ax=axes[1], label="Z")
axes[1].set_title("(b) contourf + extend='both'")

# ---- (c) 填充打底 + 白线勾边 + 标出峰值 ----
cf2 = axes[2].contourf(X, Y, Z, levels=15, cmap="Blues", alpha=0.85)
cs2 = axes[2].contour(X, Y, Z, levels=15, colors="white", linewidths=0.5)
axes[2].clabel(cs2, inline=True, fmt="%.1f", fontsize=7, colors="#333333")
iy, ix = np.unravel_index(np.argmax(Z), Z.shape)
axes[2].plot(X[iy, ix], Y[iy, ix], "r*", markersize=16, markeredgecolor="white",
             label=f"峰值 Z={Z.max():.2f}")
# 单条半高等值线:注意要传列表
axes[2].contour(X, Y, Z, levels=[Z.max() * 0.5], colors="red",
                linewidths=1.6, linestyles="--")
axes[2].legend(loc="lower right", fontsize=9)
axes[2].set_title("(c) contourf + contour + 半高线")

for ax in axes:
    ax.set_aspect("equal")
    ax.set_xlabel("x")
    ax.set_ylabel("y")
plt.tight_layout()
plt.show()(c) 是三段式叠加的标准写法:contourf 打底色 → contour 勾白边 → clabel 标数值。白线用 linewidths=0.5 就够了,粗了反而脏。