目录8
文章Matplotlib第 25 章
流线图
Matplotlib · 第 25 / 43 章
streamplot() —— 流线图
streamplot() 不画“每点的箭头”,而是积分出流线:从种子点出发沿场方向一路走下去,画成连续的曲线,再在线上点缀箭头表示方向。同样表达向量场,它比 quiver 更适合看结构——涡旋、分叉、汇聚点一眼可见,而不会被一堆箭头糊死。
Axes.streamplot(
    x, y, u, v,             # ★ 这里 x/y 必须是**一维**数组,不是 meshgrid 结果
    density=1,              # ★ 流线密度:标量或 (dens_x, dens_y)
    linewidth=None,         # 标量,或与 u 同形的数组(按场变粗细)
    color=None,             # 一色,或与 u 同形的数组(按场变色)
    cmap=None, norm=None,   # 配合 color 上色时用
    arrowsize=1,            # 箭头大小倍数
    arrowstyle="-|>",       # 箭头样式,同 FancyArrowPatch
    minlength=0.1,          # 流线最短长度(太短的丢弃)
    maxlength=4.0,          # 流线最长长度
    start_points=None,      # 手动指定种子点 (N, 2) 数组
    integration_direction="both",  # 'forward' / 'backward' / 'both'
    broken_streamlines=True,# 流线相撞时是否断开
    transform=None,
    zorder=None,
    data=None
)| 参数 | 一句话 | 默认值的影响 |
|---|---|---|
x / y |
一维坐标 | 传 meshgrid 结果会报错 |
density |
流线疏密 | 1;可传 (dx, dy) 分开控制 |
color / linewidth |
可按场变 | 传与 u 同形的数组就按值映射 |
arrowsize |
箭头大小 | 1;密流线时要调小 |
arrowstyle |
箭头样式 | '-|>' |
start_points |
种子点 | None 自动撒点 |
broken_streamlines |
相撞断开 | True;设 False 会互相穿过 |
最小示例
import numpy as np
import matplotlib.pyplot as plt

xs = np.linspace(-3, 3, 100)
ys = np.linspace(-3, 3, 100)
Xs, Ys = np.meshgrid(xs, ys)
Us = -Ys * 0.6 + Xs * 0.15
Vs = Xs * 0.6 + Ys * 0.15

fig, ax = plt.subplots()
ax.streamplot(xs, ys, Us, Vs)
plt.show()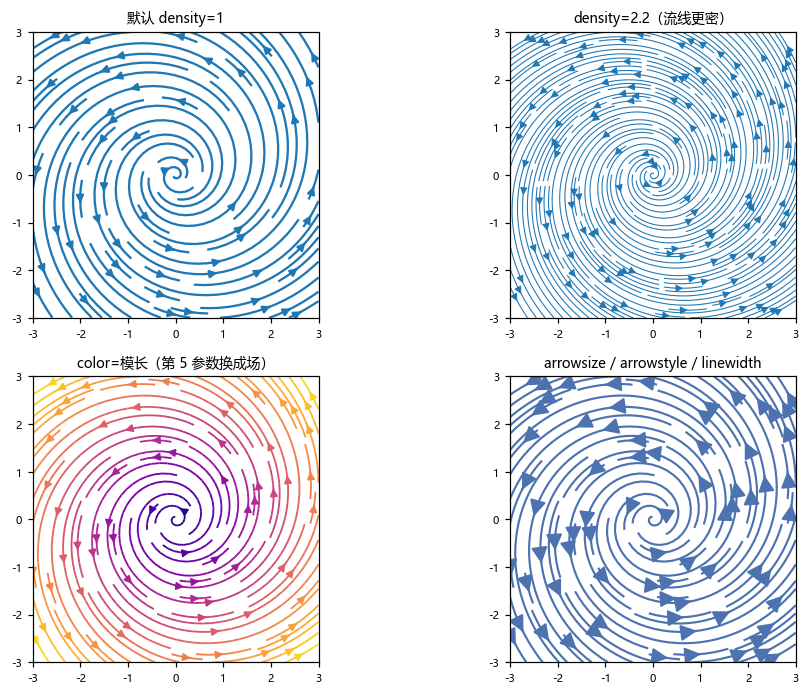
注意 x、y 传的是一维数组(xs, ys),不是 meshgrid 出来的 Xs、Ys——这是 streamplot 和 quiver / contour 最大的调用差异,写成 ax.streamplot(Xs, Ys, Us, Vs) 会报形状错误。
density:流线的疏密
ax.streamplot(xs, ys, Us, Vs, density=1.0)     # 默认
ax.streamplot(xs, ys, Us, Vs, density=2.2)     # 明显变密
ax.streamplot(xs, ys, Us, Vs, density=(2, 1))  # x 方向密、y 方向疏
density 不是“条数”,而是一个网格划分系数:值越大,撒的种子点越密。它同时影响计算量,density 从 1 到 3 可能慢好几倍。
color / linewidth:可以按场变
M = np.hypot(Us, Vs)
ax.streamplot(xs, ys, Us, Vs, color=M, cmap="plasma", density=1.2, linewidth=1.2)
这是 streamplot 相对 quiver 的独门优势:color 和 linewidth 都接受与 u 同形的数组,于是流线可以按速度着色、按强度变粗。quiver 也能上色,但整体感差很多。
arrowsize / arrowstyle
ax.streamplot(xs, ys, Us, Vs, density=1.2, arrowsize=2.2,
              arrowstyle="-|>", linewidth=1.4)
arrowsize 是倍数,arrowstyle 用 FancyArrowPatch 的样式串('-|>'、'->'、'fancy'、'simple')。流线密时必须把 arrowsize 调小(0.8~1.2),否则箭头压成黑块。
start_points / broken_streamlines
seeds = np.array([[0, 0], [1, 1], [-2, -2]])
ax.streamplot(xs, ys, Us, Vs, start_points=seeds)指定种子点后流线只从这些点出发——画“从某个源点扩散出去”的图必须用它。默认是自动均匀撒点。
broken_streamlines=False 让流线在相撞时继续穿过,会得到更“满”的图,但物理上不严谨(流线本不该相交)。
返回对象
sp = ax.streamplot(xs, ys, Us, Vs)
print(type(sp).__name__)
# 输出: StreamplotSet

print(type(sp.lines).__name__, type(sp.arrows).__name__)
# 输出: LineCollection PatchCollection

sp.lines.set_linewidth(0.8)
sp.lines.set_color("#333333")
sp.arrows.set_facecolor("#C44E52")
plt.show()StreamplotSet 是个命名元组,只有两个字段:lines(所有流线,一个 LineCollection)和 arrows(所有箭头,一个 PatchCollection)。没有“第 n 条流线”这种对象——和 stem 的杆一样,是整体管理的。
注意事项
x、y必须是一维数组,不能传meshgrid的结果(和quiver/contour相反)。density越大越慢,(dx, dy)元组可以分方向控制。color/linewidth可以传与u同形的数组,这是它比quiver强的地方。- 流线密时
arrowsize必须调小,否则箭头糊成黑块。 start_points用法是(N, 2)数组,每行一个[x, y]。- 返回的
StreamplotSet没有逐条访问接口,只能整体改样式。 - 数据里若有奇点(速度为 0),流线会在附近停住,
minlength会把这些短线段滤掉。
综合示例:涡旋 / 按速度着色 / 指定种子点
import numpy as np
import matplotlib.pyplot as plt

plt.rcParams["font.sans-serif"] = ["SimHei", "Microsoft YaHei", "DejaVu Sans"]
plt.rcParams["axes.unicode_minus"] = False

xs = np.linspace(-3, 3, 200)
ys = np.linspace(-3, 3, 200)
Xs, Ys = np.meshgrid(xs, ys)

# 两个反向涡:一个在 (-1,0),一个在 (1,0)
U1, V1 = -(Ys - 0), (Xs + 1)
U2, V2 = (Ys - 0), -(Xs - 1)
r1 = np.hypot(Xs + 1, Ys) + 0.3
r2 = np.hypot(Xs - 1, Ys) + 0.3
U = U1 / r1 ** 1.2 + U2 / r2 ** 1.2
V = V1 / r1 ** 1.2 + V2 / r2 ** 1.2
M = np.hypot(U, V)

fig, axes = plt.subplots(1, 3, figsize=(15, 4.6))

# ---- (a) 默认流线 ----
axes[0].streamplot(xs, ys, U, V, density=1.2)
axes[0].set_title("(a) density=1.2")

# ---- (b) 按速度着色 ----
sp = axes[1].streamplot(xs, ys, U, V, color=M, cmap="plasma",
                        density=1.4, linewidth=1.3, arrowsize=1.2)
fig.colorbar(sp.lines, ax=axes[1], label="|v|")
axes[1].set_title("(b) color=模长")

# ---- (c) 指定种子点:从左侧一列出发 ----
seeds = np.column_stack([np.full(9, -2.8), np.linspace(-2.4, 2.4, 9)])
axes[2].streamplot(xs, ys, U, V, start_points=seeds, density=1.0,
                   arrowsize=1.4, linewidth=1.2,
                   integration_direction="forward")
axes[2].plot(seeds[:, 0], seeds[:, 1], "r.", markersize=6, label="种子点")
axes[2].legend(fontsize=8)
axes[2].set_title("(c) start_points + forward")

for ax in axes:
    ax.set_aspect("equal")
    ax.set_xlim(-3, 3)
    ax.set_ylim(-3, 3)
plt.tight_layout()
plt.show()(b) 里 fig.colorbar(sp.lines, ...) 传的是 lines 这个 LineCollection——StreamplotSet 本身不能直接传给 colorbar,这是唯一要注意的地方。