目录18
文章Matplotlib第 29 章
刻度与格式化
Matplotlib · 第 29 / 43 章
刻度位置:set_xticks 与 Locator
刻度位置由 Locator 决定,刻度文字由 Formatter 决定,两者完全解耦。set_xticks() 是最简单的「手工 Locator」,复杂场景才用 matplotlib.ticker 里的类。
Axes.set_xticks(ticks, labels=None, *, minor=False, **kwargs)
Axes.set_xticklabels(labels, *, minor=False, fontdict=None, **kwargs)
Axes.minorticks_on()          # 打开次刻度(自动 Locator)
Axes.minorticks_off()
Axes.tick_params(axis="both", **kwargs) # 所有刻度相关开关| Locator | 用途 | 典型场景 |
|---|---|---|
MultipleLocator(base) |
固定步长 | 每 200 一格 |
MaxNLocator(nbins, steps=) |
最多 n 个「好看」刻度 | 默认就是这个 |
AutoLocator() |
默认,自动挑 | 一般不用手写 |
LinearLocator(numticks) |
等距 n 个 | 要固定数量 |
FixedLocator(ticks) |
指定位置 | 手工列表 |
IndexLocator(base, offset) |
索引步长 | 类目轴 |
LogLocator(base, subs) |
对数轴 | 配合 set_xscale('log') |
最小示例
import matplotlib.pyplot as plt
import numpy as np

fig, ax = plt.subplots()
ax.plot(np.arange(10))
ax.set_xticks([0, 3, 6, 9], ['一', '二', '三', '四'])
print([t.get_text() for t in ax.get_xticklabels()])
# 输出: ['一', '二', '三', '四']
plt.show()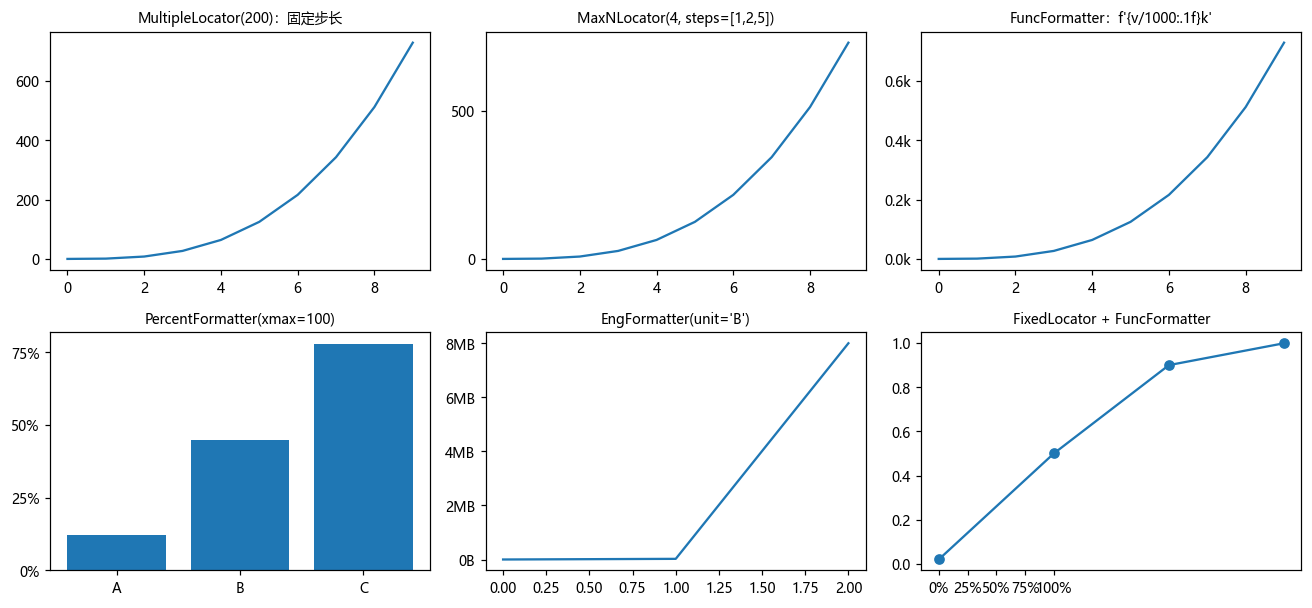
set_xticks 一行版(3.5+)
import matplotlib.pyplot as plt
import numpy as np

fig, ax = plt.subplots()
ax.plot(np.arange(10))
ax.set_xticks([0, 5], ['起点', '终点'], rotation=-45, ha='right')
print(ax.get_xticks())
# 输出: [0 5]
print([t.get_rotation() for t in ax.get_xticklabels()])
# 输出: [315.0, 315.0]第二个参数 labels 和后面的 **kwargs 都是 3.5 才加的,等价于「先 set_xticks 再 set_xticklabels(带 fontdict)」。rotation=-45 会转成 315.0(对 360 取模)。
次刻度:minor=True 与 minorticks_on
import matplotlib.pyplot as plt
import numpy as np

fig, ax = plt.subplots()
ax.plot(np.arange(10))
ax.minorticks_on()                             # 只打开开关
print(len(ax.xaxis.get_minorticklocs()))
# 输出: 16
ax.set_xticks([1, 3, 5, 7, 9], minor=True)     # 手工指定次刻度
print(len(ax.xaxis.get_minorticklocs()))
# 输出: 5
plt.show()minorticks_on() 只是「打开开关」,具体位置仍由 AutoMinorLocator 算:主刻度间隔为 2,它在每段里插 4 根,所以 arange(10) 得到 16 根。set_xticks(..., minor=True) 才是手工给位置——它把次刻度定位器整个换成 FixedLocator,原来那 16 根全部作废,两者不是叠加。
次刻度默认不显示文字——要给文字得 set_xticklabels(..., minor=True) 或 tick_params(which='minor', labelsize=...)。
陷阱:次刻度落在主刻度上会被「去重」掉,一根都不显示
set_xticks(..., minor=True) 的位置如果正好和主刻度重合,get_minorticklocs() 会返回空——不是没设进去,是被 remove_overlapping_locs 筛掉了:
import matplotlib.pyplot as plt
import numpy as np

fig, ax = plt.subplots()
ax.plot(np.arange(10))
ax.set_xticks([0, 2, 4, 6, 8], minor=True)     # 正好撞上主刻度 0/2/4/6/8
print(len(ax.xaxis.get_minorticklocs()))
# 输出: 0
print(ax.xaxis.get_minor_locator().tick_values(*ax.get_xlim()))
# 输出: [0 2 4 6 8]        ← 定位器里确实有,只是被筛掉了
ax.xaxis.remove_overlapping_locs = False       # 关掉去重
print(len(ax.xaxis.get_minorticklocs()))
# 输出: 5的三种调用结果
三种情况的表现完全不同,实测(matplotlib 3.10):
import matplotlib.pyplot as plt
import numpy as np

# A:不先 set_xticks,只发警告
fig, ax = plt.subplots()
ax.plot(np.arange(10))
ax.set_xticklabels(['甲', '乙', '丙'])
print([t.get_text() for t in ax.get_xticklabels()])
# 输出: ['甲', '乙', '丙', '', '', '', '']        ← 后 4 个刻度文字是空串
# 警告: set_ticklabels() should only be used with a fixed number of ticks...
print(type(ax.xaxis.get_major_locator()).__name__)
# 输出: AutoLocator                              ← 定位器没变,还剩 7 个刻度位置

# B:先 set_xticks,个数对得上
fig, ax = plt.subplots()
ax.plot(np.arange(10))
ax.set_xticks([0, 3, 6, 9])
ax.set_xticklabels(['甲', '乙', '丙', '丁'])
print(type(ax.xaxis.get_major_locator()).__name__)
# 输出: FixedLocator                             ← 定位器被换成固定的,无警告

# C:个数对不上 → 直接抛异常
fig, ax = plt.subplots()
ax.plot(np.arange(10))
ax.set_xticks([0, 3, 6, 9])
ax.set_xticklabels(['甲', '乙'])ValueError: The number of FixedLocator locations (4), usually from a call to
set_ticks, does not match the number of labels (2).结论:先 set_xticks() 再 set_xticklabels(),且两个列表长度必须相等。用 3.5+ 的 set_xticks(ticks, labels) 一行写法天然保证长度一致,不会踩这个坑。
tick_params:刻度的所有外观开关
import matplotlib.pyplot as plt
import numpy as np

fig, ax = plt.subplots()
ax.plot(np.arange(10))
ax.tick_params(axis='x', which='major', length=6, width=1.2,
               labelsize=9, direction='out', pad=4)
ax.tick_params(axis='both', which='minor', length=3, color='0.6')
ax.tick_params(axis='y', labelcolor='0.3', colors='steelblue')
plt.show()colors= 一次改「刻度线 + 刻度文字 + 对应的轴标签」,labelcolor= 只改文字。
| 参数 | 管什么 |
|---|---|
length / width / color |
刻度线本身 |
labelsize / labelcolor |
刻度文字 |
direction |
'in' / 'out' / 'inout' |
pad |
文字离刻度线多远(点) |
top / right / bottom / left |
是否在那一侧画刻度 |
labeltop / labelright / … |
是否在那一侧画文字 |
注意事项
set_xticks([...])不给labels时会沿用旧的 Formatter,可能显示成0.0而不是0。set_xticklabels()不先set_xticks()只发警告不出错(多出来的刻度文字变成空串);但标签个数和刻度个数对不上时是硬报错ValueError,见下面的 fold。set_xticks(..., minor=True)与minorticks_on()不是叠加,前者会直接换掉定位器。- 次刻度位置若与主刻度重合,会被
remove_overlapping_locs全部筛掉,get_minorticklocs()变空。 rotation=-45后实际存的是315.0(对 360 取模),比较时别直接和-45比。tick_params(colors=...)是「刻度线 + 刻度文字」二合一,想分开改就用color=+labelcolor=。- 3.10 没有
rotation_mode='xtick'(3.11 新增),传了报ValueError。
刻度文字:Formatter 与 ticker
Formatter 只负责「这个数值该显示成什么字符串」。它拿到的永远是数值,位置 pos 是可选的。所以「刻度显示成 1k」「显示成 12%」全靠换 Formatter,不用改数据。
Axes.set_major_formatter(fmt)     # 主刻度格式
Axes.set_minor_formatter(fmt)     # 次刻度格式
Axes.set_major_locator(loc) # 位置(Formatter 管不到位置)| Formatter | 一行说明 | 例子 |
|---|---|---|
FormatStrFormatter('%.2f') |
printf 风格 | 3.14 |
StrMethodFormatter('{x:,.0f}') |
str.format 风格 |
1,234 |
FuncFormatter(f) |
自定义函数 f(value, pos) |
f'{v/1000:.1f}k' |
PercentFormatter(xmax, decimals) |
百分比 | xmax=100 → 45% |
EngFormatter(unit, sep) |
工程单位(k/M/G) | 2.5MB |
ScalarFormatter() |
默认,带 offset/scientific | 1e6 提成 offset |
NullFormatter() |
不显示 | '' |
LogFormatterMathtext() |
对数轴 10^n |
$\mathdefault{10^{2}}$ |
最小示例
import matplotlib.pyplot as plt
import matplotlib.ticker as mticker
import numpy as np

fig, ax = plt.subplots()
ax.plot(np.arange(10) ** 3)
ax.yaxis.set_major_formatter(mticker.FuncFormatter(lambda v, _: f'{v/1000:.1f}k'))
print([t.get_text() for t in ax.get_yticklabels()][:4])
# 输出: ['-0.1k', '0.0k', '0.1k', '0.2k']
plt.show()FuncFormatter:最通用
import matplotlib.pyplot as plt
import matplotlib.ticker as mticker
import numpy as np

fig, ax = plt.subplots()
ax.plot(np.arange(10) ** 3)
ax.yaxis.set_major_formatter(mticker.FuncFormatter(lambda v, _: f'{v/1000:.1f}k'))
print([t.get_text() for t in ax.get_yticklabels()][:3])
# 输出: ['-0.1k', '0.0k', '0.1k']函数签名是 f(value, position),position 一般用不到所以写 _。返回值里可以放 $...$ 走 mathtext,比如 lambda v, _: f'${v/1000:.0f}\\times10^3$'。
PercentFormatter
import matplotlib.pyplot as plt
import matplotlib.ticker as mticker

fig, ax = plt.subplots()
ax.bar(['A', 'B'], [45, 78])
ax.yaxis.set_major_formatter(mticker.PercentFormatter(xmax=100, decimals=0))
print([t.get_text() for t in ax.get_yticklabels()][:3])
# 输出: ['0%', '10%', '20%']
plt.show()xmax 是「100% 对应多少」。数据已经是 01 比例时用 100 的百分数就用 xmax=1;数据是 0xmax=100。设错的话会得到 4500% 这种。
负号用的是 Unicode 减号 −(U+2212),不是 ASCII 的 -——写断言时要注意。
EngFormatter:工程单位
import matplotlib.pyplot as plt
import matplotlib.ticker as mticker

fig, ax = plt.subplots()
ax.plot([0, 1, 2], [1e3, 2.5e4, 8e6])
ax.yaxis.set_major_formatter(mticker.EngFormatter(unit='B', sep=''))
print([t.get_text() for t in ax.get_yticklabels()][:3])
# 输出: ['−1MB', '0B', '1MB']
plt.show()unit 是后缀,sep 是数字与单位之间的分隔符——它插在数字和 SI 前缀之间,不是插在末尾:EngFormatter(unit='B', sep=',') 把 1000 写成 1,kB(不是 1kB,)。它按 10³ 进位(k / M / G / T),和 SI 前缀一致。
另外注意上面输出里 −1MB 的那个减号:和 PercentFormatter 一样是 Unicode 减号 −(U+2212),不是键盘上的 -。写断言、做字符串匹配时按 - 去比会失败。
MaxNLocator 的 steps
import matplotlib.pyplot as plt
import matplotlib.ticker as mticker
import numpy as np

fig, ax = plt.subplots()
ax.plot(np.arange(10) ** 3)
ax.yaxis.set_major_locator(mticker.MaxNLocator(4, steps=[1, 2, 5]))
fig.canvas.draw()
print(np.round(ax.get_yticks(), 1))
# 输出: [-500. 0. 500. 1000.]steps 是「候选步长」,实际步长取 steps 里的数 × 10^k。默认 [1, 1.5, 2, 2.5, 3, 4, 5, 6, 8, 10]。
steps 里写非标准值不会报错,只是会挑出一个看起来很怪的步长:
import matplotlib.pyplot as plt
import matplotlib.ticker as mticker
import numpy as np

fig, ax = plt.subplots()
ax.plot(np.arange(10) ** 3)
ax.yaxis.set_major_locator(mticker.MaxNLocator(4, steps=[3]))
fig.canvas.draw()
print(np.round(ax.get_yticks(), 1))
# 输出: [-300. 0. 300. 600. 900.]所以「写了 steps 却没生效」不是被吞掉,而是候选集里正好有等价项。
注意事项
- Formatter 只改文字,不改位置;位置必须靠 Locator 或
set_xticks。 PercentFormatter的负号是 Unicode−(U+2212),不是-。PercentFormatter(xmax=)设错会得到4500%这种离谱结果。MaxNLocator的steps写非标准值不报错,只是刻度难看。NullFormatter()只隐藏文字,刻度线和刻度位置还在。- 默认的
ScalarFormatter在大数时会加一个1e6的 offset 标注——不想要就换StrMethodFormatter。
日期刻度:matplotlib.dates
日期轴不是「特殊轴」,而是「x 是 datetime 对象时,matplotlib 自动换成 ConciseDateFormatter」。要控制粒度就换 Locator。
matplotlib.dates.DateFormatter(fmt)          # 按 strftime 格式
matplotlib.dates.ConciseDateFormatter(locator)  # 自动省略重复部分
matplotlib.dates.MonthLocator(bymonth=None)  # 每月
matplotlib.dates.DayLocator(bymonthday=None) # 每天 / 指定日
matplotlib.dates.WeekdayLocator(byweekday)   # 每周几
matplotlib.dates.YearLocator(base=1)         # 每年
matplotlib.dates.AutoDateLocator() # 自动挑粒度最小示例
import matplotlib.dates as mdates
import matplotlib.pyplot as plt
import numpy as np
import pandas as pd

dates = pd.date_range('2026-01-01', periods=180, freq='D')
y = np.random.default_rng(0).normal(size=180).cumsum()

fig, ax = plt.subplots(figsize=(8, 3))
ax.plot(dates, y)
ax.xaxis.set_major_locator(mdates.MonthLocator())
ax.xaxis.set_major_formatter(mdates.DateFormatter('%Y-%m'))
fig.autofmt_xdate()
plt.show()主刻度管月份、次刻度管日子
import matplotlib.dates as mdates
import matplotlib.pyplot as plt
import numpy as np
import pandas as pd

dates = pd.date_range('2026-01-01', periods=60, freq='D')
fig, ax = plt.subplots(figsize=(8, 3))
ax.plot(dates, np.arange(60))
ax.xaxis.set_major_locator(mdates.MonthLocator())
ax.xaxis.set_major_formatter(mdates.DateFormatter('%m-%d'))
ax.xaxis.set_minor_locator(mdates.DayLocator(bymonthday=[1, 15]))
plt.show()bymonthday=[1, 15] 只在那两天放刻度。DayLocator() 不带参数是「每天都放」,180 天会挤成一团。
fig.autofmt_xdate():斜排
import matplotlib.dates as mdates
import matplotlib.pyplot as plt
import pandas as pd

dates = pd.date_range('2026-01-01', periods=120, freq='D')
fig, ax = plt.subplots(figsize=(8, 3))
ax.plot(dates, range(120))
ax.xaxis.set_major_formatter(mdates.DateFormatter('%Y-%m-%d'))
fig.autofmt_xdate(rotation=30, ha='right')
plt.show()它做三件事:旋转文字、设右对齐、给底部留出空间。只想要旋转就自己 plt.setp(ax.get_xticklabels(), rotation=30, ha='right')。
注意事项
- 日期轴要求 x 是
datetime对象(pd.date_range或datetime.date),字符串不行。 DayLocator()不带参数是「每天」,长时间跨度会挤成一团。fig.autofmt_xdate()会改ha和边距,不只是旋转。DateFormatter用strftime语法,不是{}格式串。- 没设 Formatter 时 matplotlib 会用
ConciseDateFormatter,它会自动省略重复的年月——这解释了「为什么日期标签有时只剩日」。 - 时区相关的
mdates函数在 3.10 已有部分弃用,跨时区数据建议先转成 naive datetime。