文章Matplotlib第 43 章
与 Pandas / NumPy 配合
Matplotlib · 第 43 / 43 章
Python12 行
import matplotlib.pyplot as plt
import numpy as np
import pandas as pd

rng = np.random.default_rng(0)
df = pd.DataFrame(rng.normal(size=(12, 3)).cumsum(axis=0),
                  columns=list('ABC'),
                  index=pd.date_range('2026-01-01', periods=12, freq='ME'))

ax = df.plot(figsize=(8, 3.5), marker='o', title='月度累计', grid=True)
ax.set_ylabel('累计值')
ax.figure.savefig('X_pandas.png', dpi=150, bbox_inches='tight')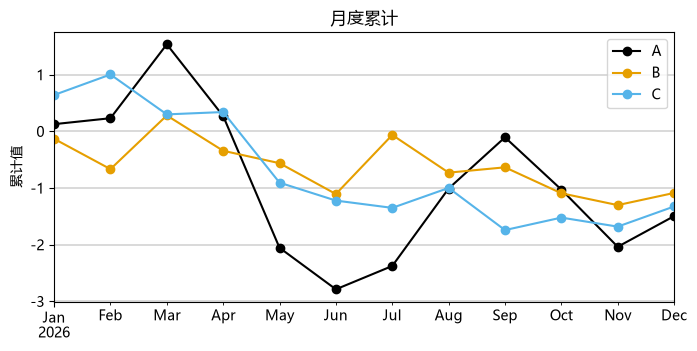 Pandas 的
plot() 是 matplotlib 的薄封装,返回 Axes,所以样式仍要用 ax.set_* / plt.rcParams:
Python14 行
import pandas as pd
import matplotlib.pyplot as plt
import numpy as np
df = pd.DataFrame({'a': [1, 2, 3], 'b': [3, 2, 1]}, index=['x', 'y', 'z'])

ax = df.plot(kind='bar', subplots=True, layout=(1, 2), sharex=False,
             title=['A 列', 'B 列'], width=.7, legend=False, color='C0')
ax[0, 0].set_xticklabels(df.index)              # subplots=True + layout=(1,2) → 返回 2D 数组
ax[0, 1].axhline(1.5, color='crimson', ls='--')
print(type(ax).__name__, ax.shape)              # 输出: ndarray (1, 2)

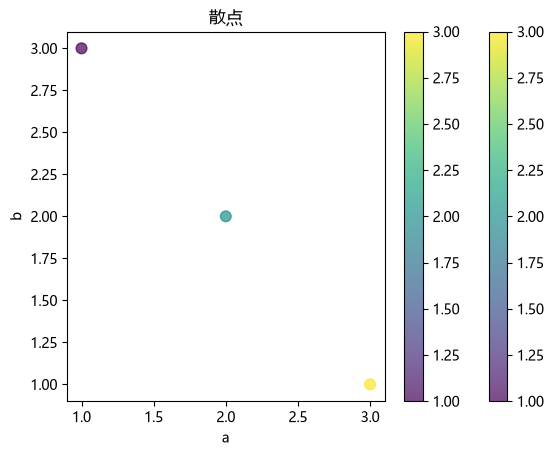
ax2 = df.plot(kind='scatter', x='a', y='b', s=60, alpha=.7,
              c=df['a'], cmap='viridis', title='散点')
ax2.figure.colorbar(ax2.collections[0], ax=ax2)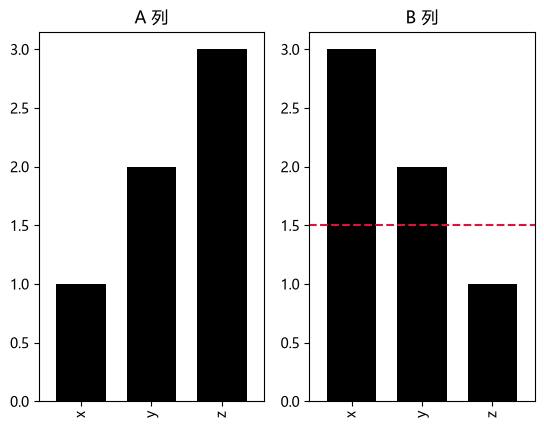
 用
plt.subplots + ax.plot 直接吃 DataFrame(需要更多控制时):
Python16 行
import matplotlib.pyplot as plt
import pandas as pd
import numpy as np

df = pd.DataFrame({'a': [1, 2, 3], 'b': [3, 2, 1]}, index=['x', 'y', 'z'])
fig, ax = plt.subplots()
for col in df.columns:
    ax.plot(df.index, df[col], marker='o', label=col.upper())
ax.legend(); ax.grid(alpha=.3)

# pandas 的 DatetimeIndex / CategoricalIndex 会被自动识别为日期轴与类目轴
idx = pd.date_range('2026-01-01', periods=10, freq='D')
ax2 = plt.figure().add_subplot()
ax2.plot(idx, np.random.default_rng(0).normal(size=10).cumsum())
ax2.set_title('自动按日期格式化')                 # 不需要手动 DateFormatter
plt.show()