HISTOGRAM
绘图 · 第 1 / 36 章
单组数据直方图
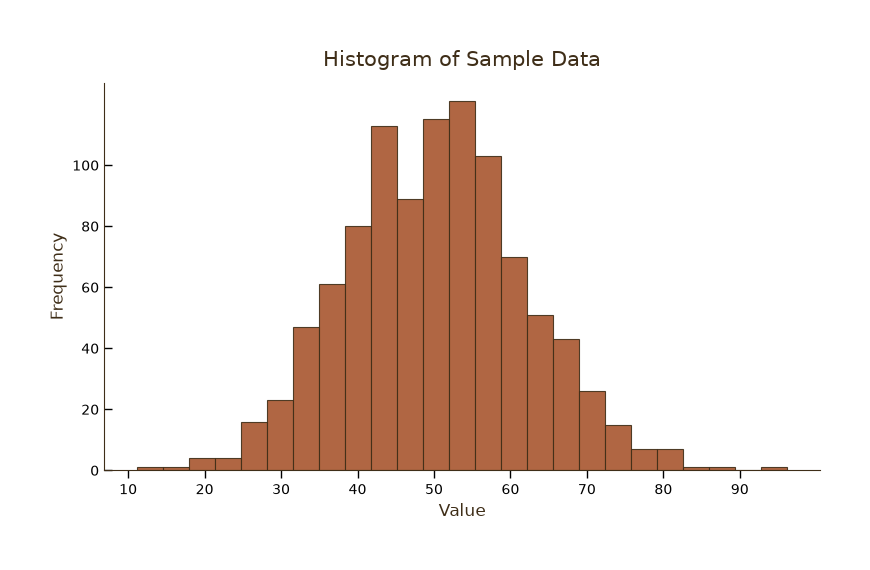
单组数据直方图
Python66 行
import matplotlib.pyplot as plt
import numpy as np
from matplotlib.ticker import MultipleLocator, AutoMinorLocator

# 主题色
colors = ["#A8552E", "#35666E", "#D0A64F", "#3F2E18", "#7E8F52"]

# 生成示例数据(正态分布)
np.random.seed(42)
data = np.random.normal(loc=50, scale=12, size=1000)

# 创建画布
fig, ax = plt.subplots(figsize=(8, 5))

# 绘制直方图
n, bins, patches = ax.hist(
    data,
    bins=25,
    color=colors[0],
    edgecolor=colors[3],
    linewidth=0.8,
    alpha=0.9,
)

# 标题与标签
ax.set_title("Histogram of Sample Data", fontsize=15, color=colors[3], pad=12)
ax.set_xlabel("Value", fontsize=12, color=colors[3])
ax.set_ylabel("Frequency", fontsize=12, color=colors[3])


# 主刻度位置
ax.set_xticks(np.arange(10, 100, 10))     # X 轴主刻度:10, 20, ..., 90
ax.set_yticks(np.arange(0, 110, 20))      # Y 轴主刻度:0, 20, ..., 100

# 刻度样式:颜色、大小、方向、长度
ax.tick_params(
    axis='x',
    which="major",              # 主刻度
    colors='black',
    labelsize=10,
    direction="out",
    length=6,
    width=1.0,
)

ax.tick_params(
    axis='y',
    which="major",              # 主刻度
    colors='black',
    labelsize=10,
    direction="in",
    length=6,
    width=1.0,
)

# 图例
ax.legend(frameon=False, fontsize=10, labelcolor=colors[1])

# 去除顶部和右侧边框
for spine in ["top", "right"]:
    ax.spines[spine].set_visible(False)
ax.spines["left"].set_color(colors[3])
ax.spines["bottom"].set_color(colors[3])

plt.tight_layout()
plt.show()多组数据对比直方图
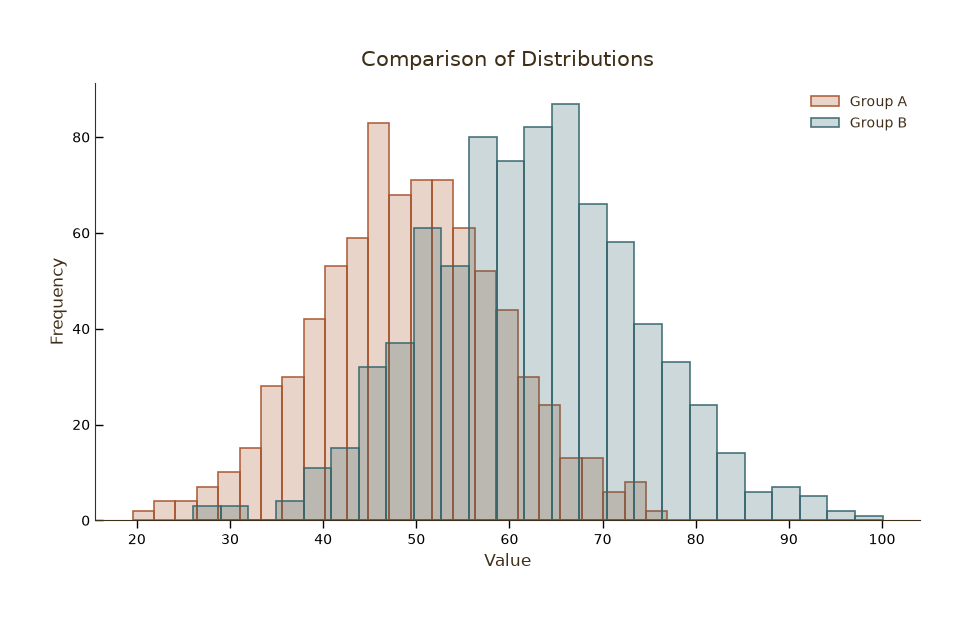
多组数据对比直方图
Python70 行
import matplotlib.pyplot as plt
import numpy as np
from matplotlib.colors import to_rgba

colors = ["#A8552E", "#35666E"]

np.random.seed(0)
groups = {
    "Group A": np.random.normal(50, 10, 800),
    "Group B": np.random.normal(62, 12, 800),
}

fig, ax = plt.subplots(figsize=(9, 5.5))

# ==================== 去除背景色 ====================
fig.patch.set_facecolor("white")   # 画布背景:白色
ax.set_facecolor("white")          # 坐标区背景:白色


# 内部透明度(高透明)和边缘透明度(低透明)
fill_alpha = 0.25
edge_alpha = 0.9

for (name, values), color in zip(groups.items(), colors):
    face = to_rgba(color, fill_alpha)
    edge = to_rgba(color, edge_alpha)
    ax.hist(
        values,
        bins=25,
        label=name,
        color=face,
        edgecolor=edge,
        linewidth=1.2,
    )

ax.set_title("Comparison of Distributions", fontsize=15, color="#3F2E18", pad=12)
ax.set_xlabel("Value", fontsize=12, color="#3F2E18")
ax.set_ylabel("Frequency", fontsize=12, color="#3F2E18")
# ax.tick_params(axis="both", colors="#3F2E18")

ax.legend(frameon=False, fontsize=10, labelcolor="#3F2E18")

ax.tick_params(
    axis='x',
    which="major",              # 主刻度
    colors='black',
    labelsize=10,
    direction="out",
    length=6,
    width=1.0,
)

ax.tick_params(
    axis='y',
    which="major",              # 主刻度
    colors='black',
    labelsize=10,
    direction="in",
    length=6,
    width=1.0,
)

# 去除顶部和右侧边框
for spine in ["top", "right"]:
    ax.spines[spine].set_visible(False)
ax.spines["left"].set_color("#3F2E18")
ax.spines["bottom"].set_color("#3F2E18")

plt.tight_layout()
plt.show()