VIOLIN PLOT
绘图 · 第 5 / 36 章
单组小提琴图
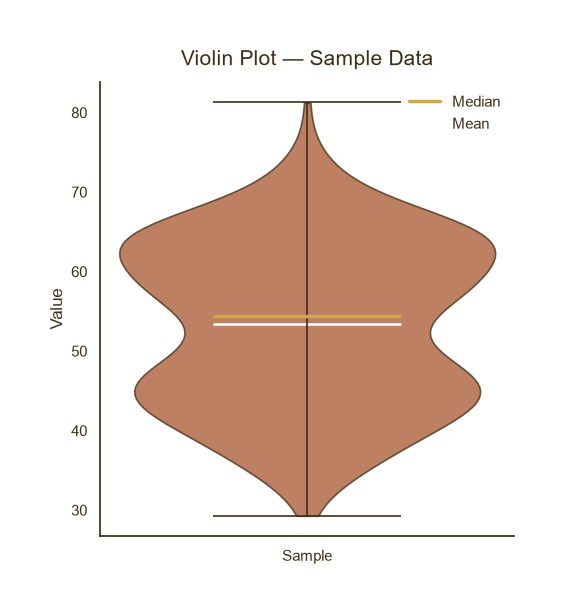
单组小提琴图
Python66 行
import matplotlib.pyplot as plt
from matplotlib.lines import Line2D
import numpy as np

COLORS = ["#A8552E", "#35666E", "#D0A64F", "#3F2E18", "#7E8F52"]

np.random.seed(42)
data = np.concatenate([
    np.random.normal(45, 6, 150),
    np.random.normal(62, 5, 150),
])

fig, ax = plt.subplots(figsize=(5, 5.5))

vp = ax.violinplot(
    data,
    positions=[1],
    widths=0.7,
    showmeans=True,
    showmedians=True,
    showextrema=True,
)

# 主题色填充
for body in vp["bodies"]:
    body.set_facecolor(COLORS[0])
    body.set_edgecolor(COLORS[3])
    body.set_alpha(0.75)
    body.set_linewidth(1.2)

# 内部线条配色
for part in ("cbars", "cmins", "cmaxes"):
    vp[part].set_color(COLORS[3])
    vp[part].set_linewidth(1.2)
vp["cmedians"].set_color(COLORS[2])      # 中位数金黄
vp["cmedians"].set_linewidth(2.5)
vp["cmeans"].set_color("white")          # 均值白色
vp["cmeans"].set_linewidth(1.8)

# ---- 新增:为中位数和均值创建图例 ----
legend_handles = [
    Line2D([0], [0], color=COLORS[2], linewidth=2.5, label="Median"),
    Line2D([0], [0], color="white", linewidth=1.8, label="Mean"),
]

legend = ax.legend(
    handles=legend_handles,
    loc="upper right",
    frameon=False,                      # 去掉边框
    labelcolor=COLORS[3],               # 文字颜色
    fontsize=11,
)
# ------------------------------------------

ax.set_title("Violin Plot — Sample Data", fontsize=15, color=COLORS[3], pad=12)
ax.set_ylabel("Value", fontsize=12, color=COLORS[3])
ax.set_xticks([1]); ax.set_xticklabels(["Sample"])
ax.tick_params(axis="both", colors=COLORS[3])

for s in ("top", "right"):
    ax.spines[s].set_visible(False)
ax.spines["left"].set_color(COLORS[3])
ax.spines["bottom"].set_color(COLORS[3])

plt.tight_layout()
plt.show()多组对比
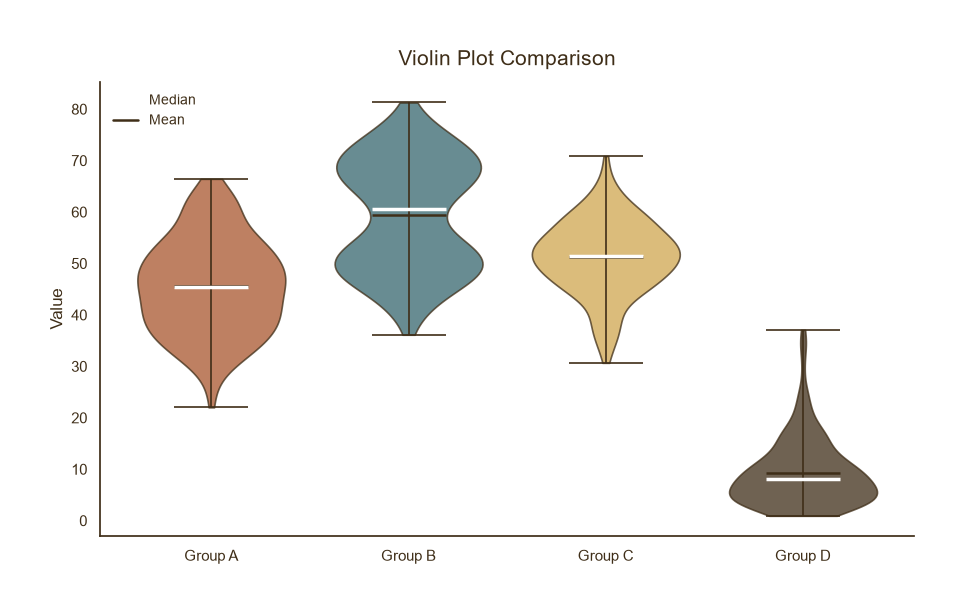
多组对比
Python67 行
import matplotlib.pyplot as plt
import numpy as np
from matplotlib.lines import Line2D

COLORS = ["#A8552E", "#35666E", "#D0A64F", "#3F2E18", "#7E8F52"]

np.random.seed(0)
groups = {
    "Group A": np.random.normal(45, 9, 200),
    "Group B": np.concatenate([np.random.normal(50, 5, 100),
                               np.random.normal(70, 5, 100)]),   # 双峰
    "Group C": np.random.normal(52, 7, 200),
    "Group D": np.random.gamma(2, 5, 200),                       # 右偏
}

fig, ax = plt.subplots(figsize=(9, 5.5))

vp = ax.violinplot(
    groups.values(),
    positions=range(1, len(groups) + 1),
    widths=0.75,
    showmeans=True,
    showmedians=True,
    showextrema=True,
)

for body, c in zip(vp["bodies"], COLORS):
    body.set_facecolor(c)
    body.set_edgecolor(COLORS[3])
    body.set_alpha(0.75)
    body.set_linewidth(1.2)

for part in ("cbars", "cmins", "cmaxes"):
    vp[part].set_color(COLORS[3])
    vp[part].set_linewidth(1.2)
vp["cmedians"].set_color("white")
vp["cmedians"].set_linewidth(2.5)
vp["cmeans"].set_color(COLORS[3])
vp["cmeans"].set_linewidth(1.8)

ax.set_title("Violin Plot Comparison", fontsize=15, color=COLORS[3], pad=12)
ax.set_ylabel("Value", fontsize=12, color=COLORS[3])
ax.set_xticks(range(1, len(groups) + 1))
ax.set_xticklabels(groups.keys())
ax.tick_params(axis="both", colors=COLORS[3])

for s in ("top", "right"):
    ax.spines[s].set_visible(False)
ax.spines["left"].set_color(COLORS[3])
ax.spines["bottom"].set_color(COLORS[3])

# ============ 只保留中位数 + 均值图例 ============
legend_handles = [
    Line2D([0], [0], color="white", linewidth=2.5, label="Median"),
    Line2D([0], [0], color=COLORS[3], linewidth=1.8, label="Mean"),
]
ax.legend(
    handles=legend_handles,
    frameon=False,
    fontsize=10,
    labelcolor=COLORS[3],
    loc="upper left",
    handlelength=1.8,
)

plt.tight_layout()
plt.show()小提琴 + 箱线 + 散点
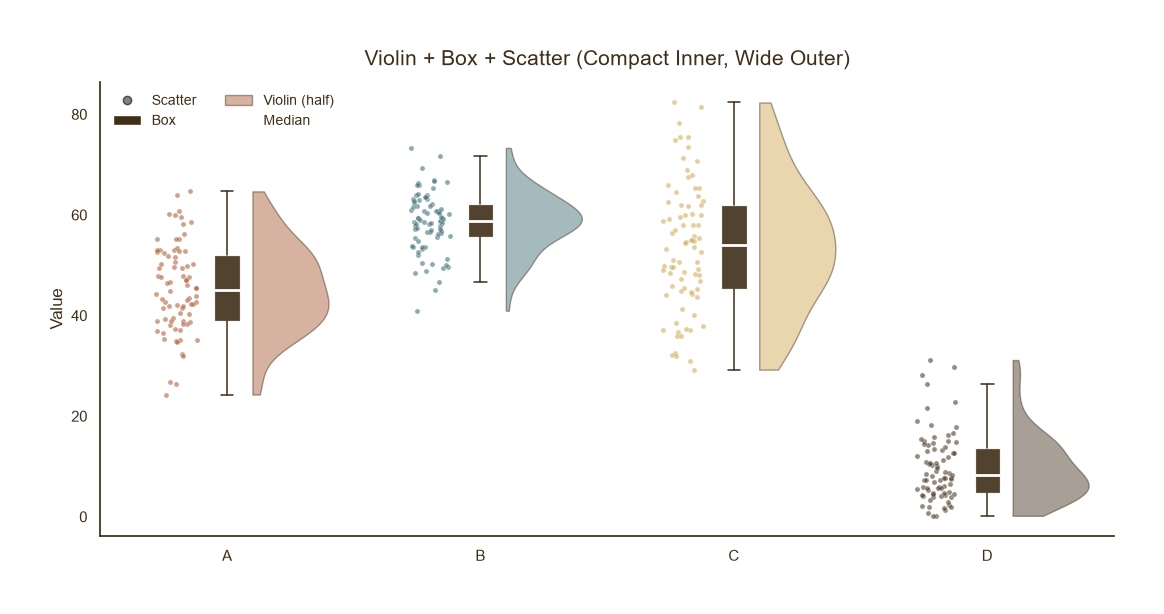
小提琴 + 箱线 + 散点
Python93 行
import matplotlib.pyplot as plt
import numpy as np
from scipy.stats import gaussian_kde
from matplotlib.patches import Patch
from matplotlib.lines import Line2D

COLORS = ["#A8552E", "#35666E", "#D0A64F", "#3F2E18", "#7E8F52"]

np.random.seed(1)
groups = {
    "A": np.random.normal(45, 9, 80),
    "B": np.random.normal(58, 7, 80),
    "C": np.random.normal(52, 12, 80),
    "D": np.random.gamma(2, 5, 80),
}

# ---------- 布局参数 ----------
GROUP_GAP   = 1    # 组间中心距(越大越疏)
INNER_GAP   = 0.1    # 组内三块的间距(越小越紧)
SCATTER_W   = 0.08    # 散点抖动幅度
BOX_W       = 0.10    # 箱体宽度
VIOLIN_W    = 0.30    # 半小提琴最大宽度

fig, ax = plt.subplots(figsize=(11, 5.5))

centers = np.arange(len(groups)) * GROUP_GAP   # 每个分组的中心

for center, (name, vals), c in zip(centers, groups.items(), COLORS):
    # 三块的相对位置
    x_scatter = center - INNER_GAP * 2
    x_box     = center
    x_violin  = center + INNER_GAP

    # ---------- 1) 散点 ----------
    jitter = np.random.uniform(-SCATTER_W, SCATTER_W, len(vals))
    ax.scatter(x_scatter + jitter, vals,
               s=14, color=c, alpha=0.55,
               edgecolor="white", linewidth=0.4, zorder=3)

    # ---------- 2) 箱线 ----------
    bp = ax.boxplot(
        vals, positions=[x_box], widths=BOX_W,
        patch_artist=True, showfliers=False,
        medianprops=dict(color="white", linewidth=2),
        whiskerprops=dict(color=COLORS[3], linewidth=1.1),
        capprops=dict(color=COLORS[3], linewidth=1.1),
        zorder=2,
    )
    for patch in bp["boxes"]:
        patch.set_facecolor(COLORS[3])
        patch.set_alpha(0.9)
        patch.set_edgecolor("white")
        patch.set_linewidth(0.9)

    # ---------- 3) 半小提琴 ----------
    kde = gaussian_kde(vals)
    ys = np.linspace(vals.min(), vals.max(), 200)
    dens = kde(ys)
    dens = dens / dens.max() * VIOLIN_W
    ax.fill_betweenx(
        ys, x_violin, x_violin + dens,
        facecolor=c, alpha=0.45,
        edgecolor=COLORS[3], linewidth=1.0, zorder=1,
    )

# ---------- 坐标轴 ----------
ax.set_title("Violin + Box + Scatter (Compact Inner, Wide Outer)",
             fontsize=15, color=COLORS[3], pad=12)
ax.set_ylabel("Value", fontsize=12, color=COLORS[3])
ax.set_xticks(centers)
ax.set_xticklabels(groups.keys())
ax.tick_params(axis="both", colors=COLORS[3])

for s in ("top", "right"):
    ax.spines[s].set_visible(False)
ax.spines["left"].set_color(COLORS[3])
ax.spines["bottom"].set_color(COLORS[3])

# ---------- 图例 ----------
legend_handles = [
    Line2D([0], [0], marker="o", color="none",
           markerfacecolor=COLORS[3], markersize=6, alpha=0.6,
           label="Scatter"),
    Patch(facecolor=COLORS[3], edgecolor="white", label="Box"),
    Patch(facecolor=COLORS[0], edgecolor=COLORS[3], alpha=0.45,
          label="Violin (half)"),
    Line2D([0], [0], color="white", linewidth=2, label="Median"),
]
ax.legend(handles=legend_handles, frameon=False, fontsize=10,
          labelcolor=COLORS[3], loc="upper left", ncol=2)

plt.tight_layout()
plt.show()分半小提琴
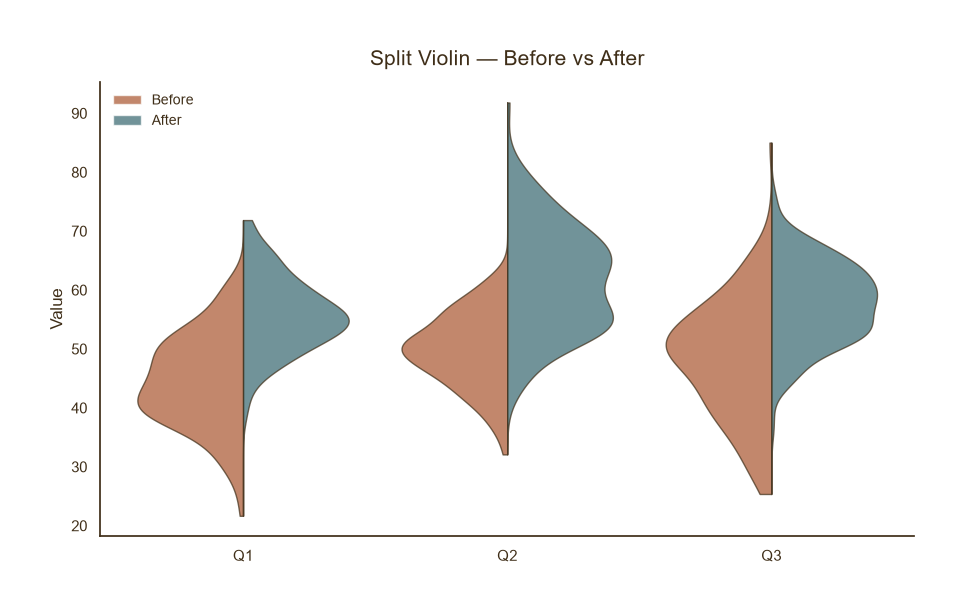
分半小提琴
Python48 行
import matplotlib.pyplot as plt
import numpy as np
from scipy.stats import gaussian_kde

COLORS = ["#A8552E", "#35666E", "#D0A64F", "#3F2E18", "#7E8F52"]

def split_violin(ax, left, right, pos, color_l, color_r, width=0.8):
    """左右分半小提琴。"""
    ys = np.linspace(min(left.min(), right.min()),
                     max(left.max(), right.max()), 200)
    kl = gaussian_kde(left)(ys)
    kr = gaussian_kde(right)(ys)
    kl = kl / kl.max() * width / 2
    kr = kr / kr.max() * width / 2
    ax.fill_betweenx(ys, pos - kl, pos, color=color_l, alpha=0.7, edgecolor=COLORS[3], linewidth=1)
    ax.fill_betweenx(ys, pos, pos + kr, color=color_r, alpha=0.7, edgecolor=COLORS[3], linewidth=1)

np.random.seed(3)
pairs = {
    "Q1": (np.random.normal(45, 8, 150), np.random.normal(55, 6, 150)),
    "Q2": (np.random.normal(50, 6, 150), np.random.normal(62, 9, 150)),
    "Q3": (np.random.normal(48, 10, 150), np.random.normal(58, 7, 150)),
}

fig, ax = plt.subplots(figsize=(9, 5.5))

for i, (name, (l, r)) in enumerate(pairs.items(), 1):
    split_violin(ax, l, r, i, COLORS[0], COLORS[1])

ax.set_title("Split Violin — Before vs After", fontsize=15, color=COLORS[3], pad=12)
ax.set_ylabel("Value", fontsize=12, color=COLORS[3])
ax.set_xticks(range(1, len(pairs) + 1))
ax.set_xticklabels(pairs.keys())
ax.tick_params(axis="both", colors=COLORS[3])

# 手工图例
from matplotlib.patches import Patch
ax.legend(handles=[Patch(facecolor=COLORS[0], alpha=0.7, label="Before"),
                   Patch(facecolor=COLORS[1], alpha=0.7, label="After")],
          frameon=False, fontsize=10, labelcolor=COLORS[3], loc="upper left")

for s in ("top", "right"):
    ax.spines[s].set_visible(False)
ax.spines["left"].set_color(COLORS[3])
ax.spines["bottom"].set_color(COLORS[3])

plt.tight_layout()
plt.show()