TREEMAP
绘图 · 第 25 / 36 章
基础矩形树图
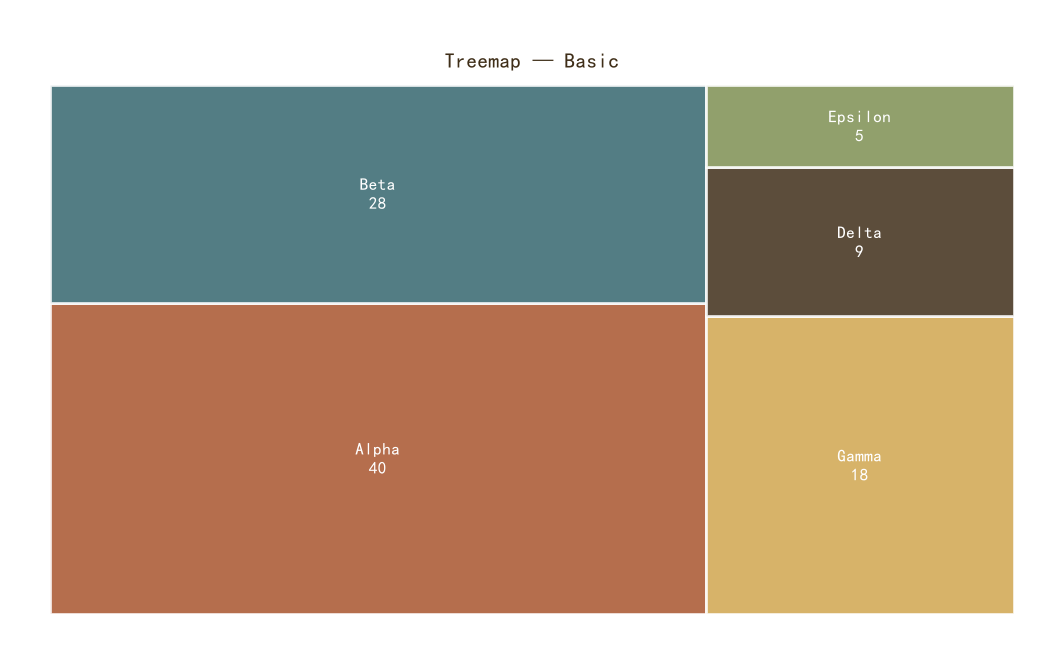
基础矩形树图
Python27 行
import matplotlib.pyplot as plt
import squarify

COLORS = ["#A8552E", "#35666E", "#D0A64F", "#3F2E18", "#7E8F52"]
BG = "#F7F3EC"

labels = ["Alpha", "Beta", "Gamma", "Delta", "Epsilon"]
values = [40, 28, 18, 9, 5]

fig, ax = plt.subplots(figsize=(10, 6))

squarify.plot(
    sizes=values,
    label=[f"{l}\n{v}" for l, v in zip(labels, values)],
    color=COLORS[:len(values)],
    alpha=0.85,
    edgecolor="white",
    linewidth=2.0,
    text_kwargs={"color": "white", "fontsize": 12, "fontweight": "bold"},
    ax=ax,
)

ax.axis("off")   # 矩形树图不需要坐标轴
ax.set_title("Treemap — Basic", fontsize=15, color=COLORS[3], pad=12)

plt.tight_layout()
plt.show()带颜色渐变的矩形树图
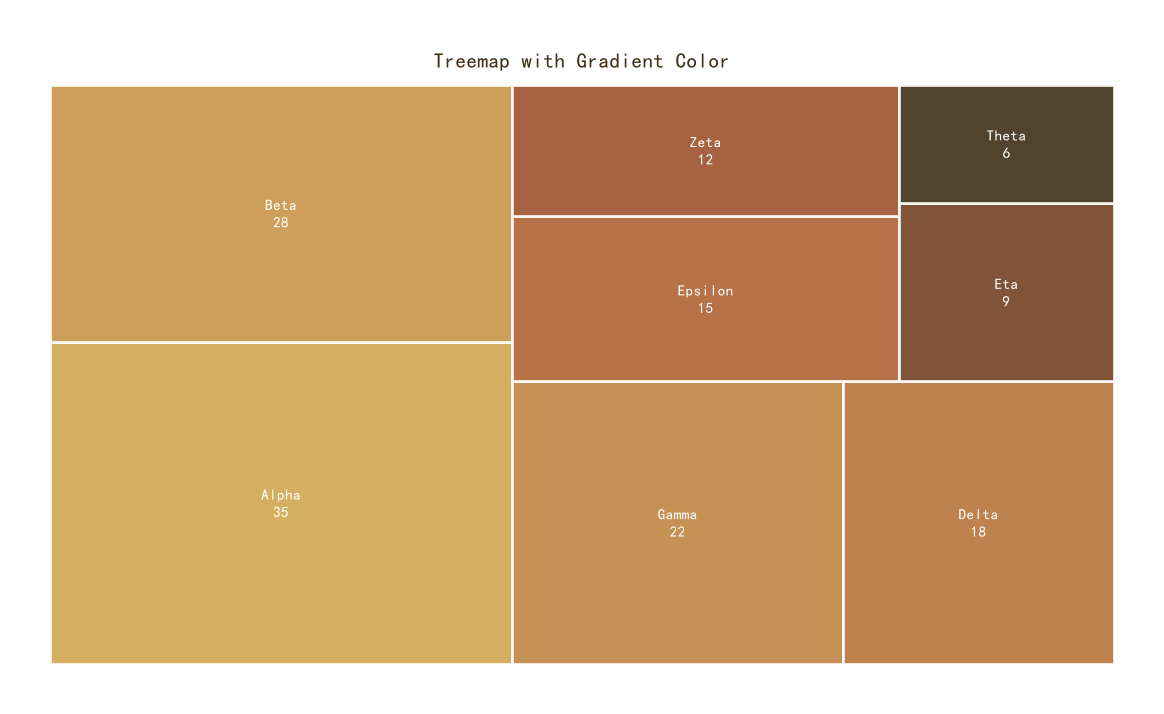
带颜色渐变的矩形树图
Python36 行
import matplotlib.pyplot as plt
import squarify
from matplotlib.colors import LinearSegmentedColormap

BG = "#F7F3EC"
CMAP = LinearSegmentedColormap.from_list(
    "theme", ["#D0A64F", "#A8552E", "#3F2E18"], N=256
)

labels = ["Alpha", "Beta", "Gamma", "Delta", "Epsilon",
          "Zeta", "Eta", "Theta"]
values = [35, 28, 22, 18, 15, 12, 9, 6]

# 归一化 → 映射颜色
norm = (np.array(values) - min(values)) / (max(values) - min(values))
colors = [CMAP(n) for n in norm[::-1]]   # 大的值用深色

fig, ax = plt.subplots(figsize=(11, 6.5))

squarify.plot(
    sizes=values,
    label=[f"{l}\n{v}" for l, v in zip(labels, values)],
    color=colors,
    alpha=0.9,
    edgecolor="white",
    linewidth=2.0,
    text_kwargs={"color": "white", "fontsize": 11, "fontweight": "bold"},
    ax=ax,
)

ax.axis("off")
ax.set_title("Treemap with Gradient Color",
             fontsize=15, color="#3F2E18", pad=12)

plt.tight_layout()
plt.show()对比矩形树图(多时间点)
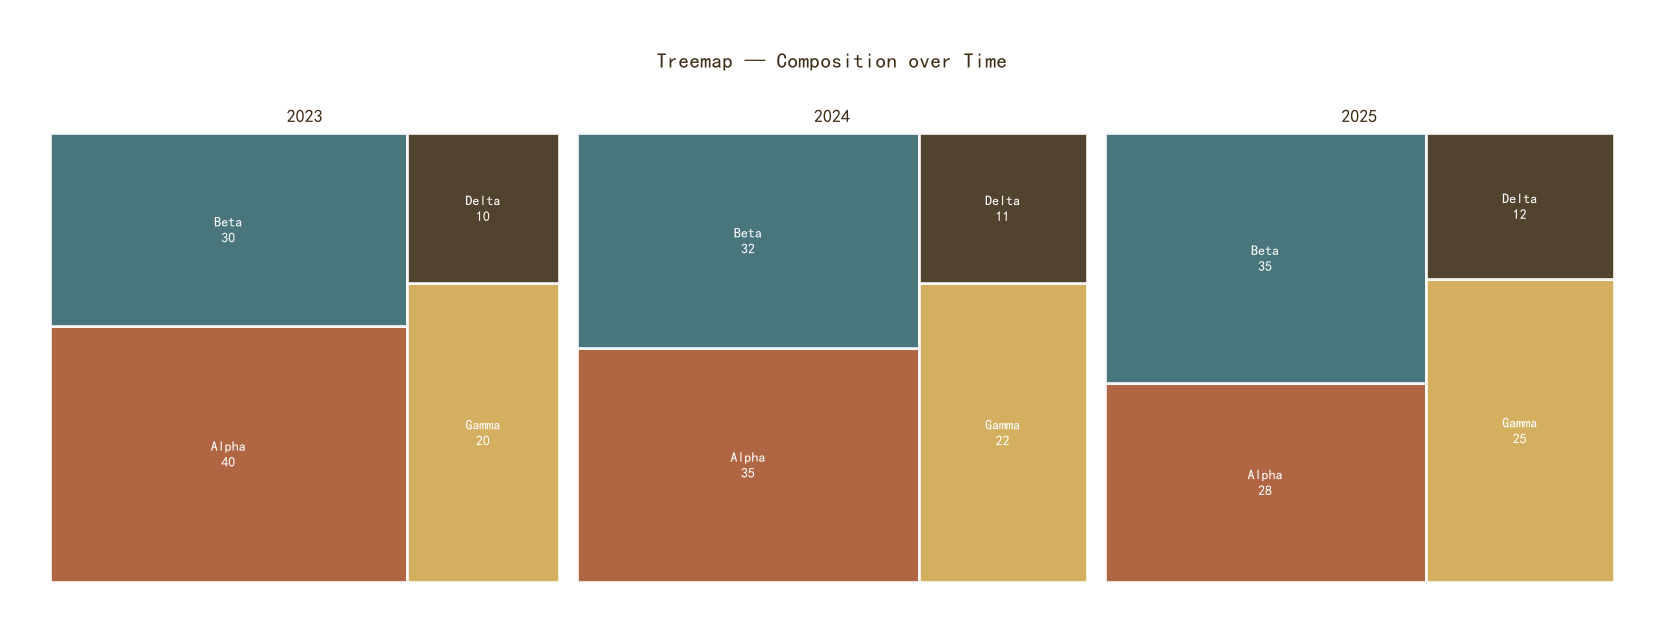
对比矩形树图(多时间点)
Python35 行
import matplotlib.pyplot as plt
import squarify

COLORS = ["#A8552E", "#35666E", "#D0A64F", "#3F2E18", "#7E8F52"]
BG = "#F7F3EC"

labels = ["Alpha", "Beta", "Gamma", "Delta"]
snapshots = {
    "2023": [40, 30, 20, 10],
    "2024": [35, 32, 22, 11],
    "2025": [28, 35, 25, 12],
}

fig, axes = plt.subplots(1, 3, figsize=(16, 5.5))

for ax, (year, values) in zip(axes, snapshots.items()):
    squarify.plot(
        sizes=values,
        label=[f"{l}\n{v}" for l, v in zip(labels, values)],
        color=COLORS[:len(values)],
        alpha=0.9,
        edgecolor="white",
        linewidth=2.0,
        text_kwargs={"color": "white", "fontsize": 10,
                     "fontweight": "bold"},
        ax=ax,
    )
    ax.axis("off")
    ax.set_title(year, fontsize=13, color=COLORS[3], pad=8)

fig.suptitle("Treemap — Composition over Time",
             fontsize=15, color=COLORS[3], y=1.00)

plt.tight_layout()
plt.show()