VENN DIAGRAM
绘图 · 第 27 / 36 章
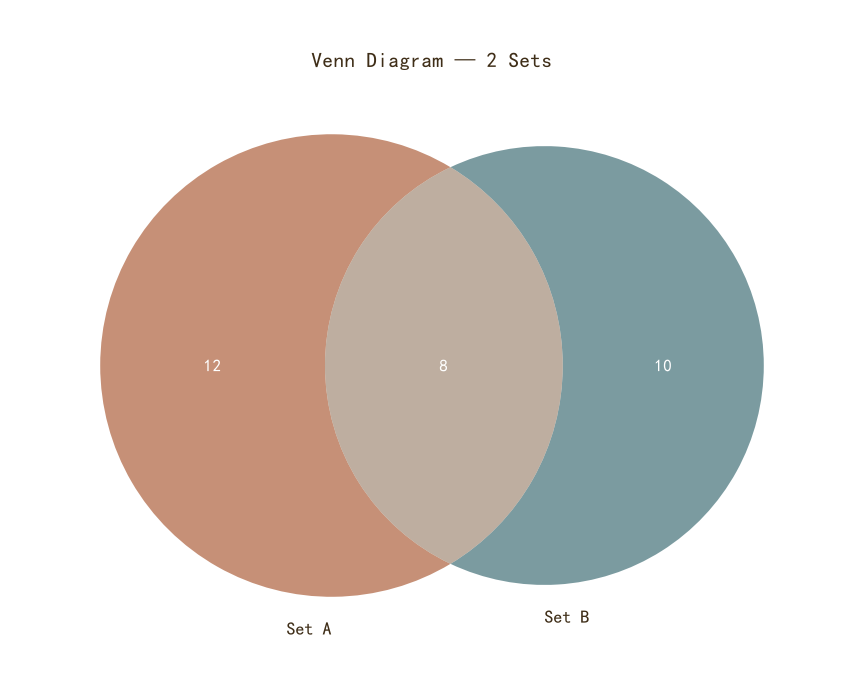
VENN DIAGRAM
Python35 行
import matplotlib.pyplot as plt
from matplotlib_venn import venn2

COLORS = ["#A8552E", "#35666E", "#D0A64F", "#3F2E18", "#7E8F52"]
BG = "#F7F3EC"

# 集合大小:A=20,B=18,交集=8
fig, ax = plt.subplots(figsize=(8, 7))

v = venn2(
    subsets=(12, 10, 8),        # (A only, B only, A∩B)
    set_labels=("Set A", "Set B"),
    set_colors=(COLORS[0], COLORS[1]),
    alpha=0.65,
    ax=ax,
)

# 文字样式
for text in v.set_labels:
    if text:
        text.set_color(COLORS[3])
        text.set_fontsize(13)
        text.set_fontweight("bold")

for text in v.subset_labels:
    if text:
        text.set_color("white")
        text.set_fontsize(12)
        text.set_fontweight("bold")

ax.set_title("Venn Diagram — 2 Sets",
             fontsize=15, color=COLORS[3], pad=12)

plt.tight_layout()
plt.show()三集合韦恩图
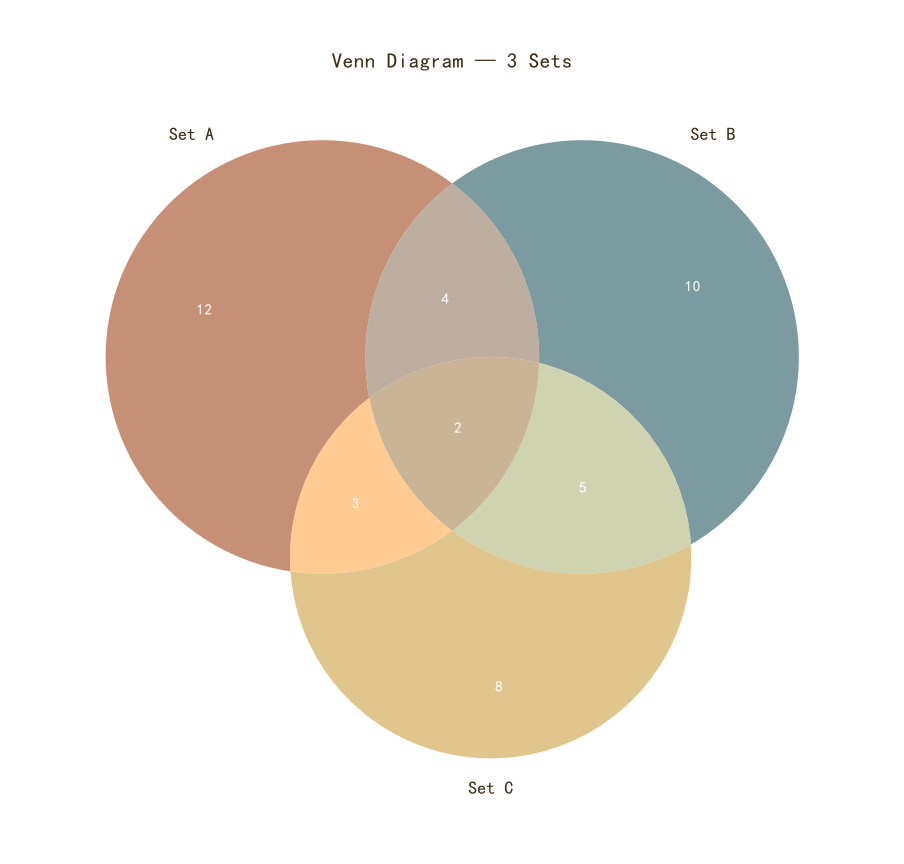
三集合韦恩图
Python33 行
import matplotlib.pyplot as plt
from matplotlib_venn import venn3

COLORS = ["#A8552E", "#35666E", "#D0A64F", "#3F2E18", "#7E8F52"]
BG = "#F7F3EC"

fig, ax = plt.subplots(figsize=(9, 8))

v = venn3(
    subsets=(12, 10, 4, 8, 3, 5, 2),   # 见下方顺序说明
    set_labels=("Set A", "Set B", "Set C"),
    set_colors=(COLORS[0], COLORS[1], COLORS[2]),
    alpha=0.65,
    ax=ax,
)

for text in v.set_labels:
    if text:
        text.set_color(COLORS[3])
        text.set_fontsize(13)
        text.set_fontweight("bold")

for text in v.subset_labels:
    if text:
        text.set_color("white")
        text.set_fontsize(11)
        text.set_fontweight("bold")

ax.set_title("Venn Diagram — 3 Sets",
             fontsize=15, color=COLORS[3], pad=12)

plt.tight_layout()
plt.show()从真实集合计算
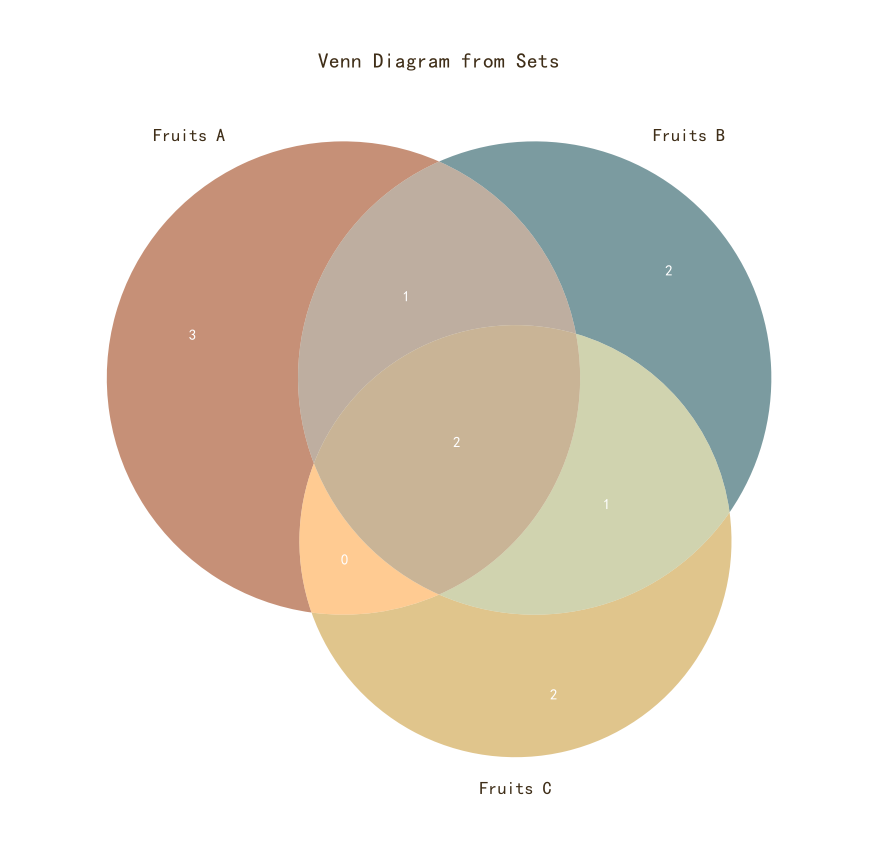
从真实集合计算
Python38 行
import matplotlib.pyplot as plt
from matplotlib_venn import venn3

COLORS = ["#A8552E", "#35666E", "#D0A64F", "#3F2E18", "#7E8F52"]
BG = "#F7F3EC"

# 三个真实集合
A = {"apple", "banana", "cherry", "date", "elderberry", "fig"}
B = {"banana", "cherry", "grape", "honeydew", "fig", "kiwi"}
C = {"cherry", "fig", "lemon", "mango", "kiwi"}

fig, ax = plt.subplots(figsize=(9, 8))

v = venn3(
    [A, B, C],
    set_labels=("Fruits A", "Fruits B", "Fruits C"),
    set_colors=(COLORS[0], COLORS[1], COLORS[2]),
    alpha=0.65,
    ax=ax,
)

for text in v.set_labels:
    if text:
        text.set_color(COLORS[3])
        text.set_fontsize(13)
        text.set_fontweight("bold")

for text in v.subset_labels:
    if text:
        text.set_color("white")
        text.set_fontsize(11)
        text.set_fontweight("bold")

ax.set_title("Venn Diagram from Sets",
             fontsize=15, color=COLORS[3], pad=12)

plt.tight_layout()
plt.show()带自定义区域标注
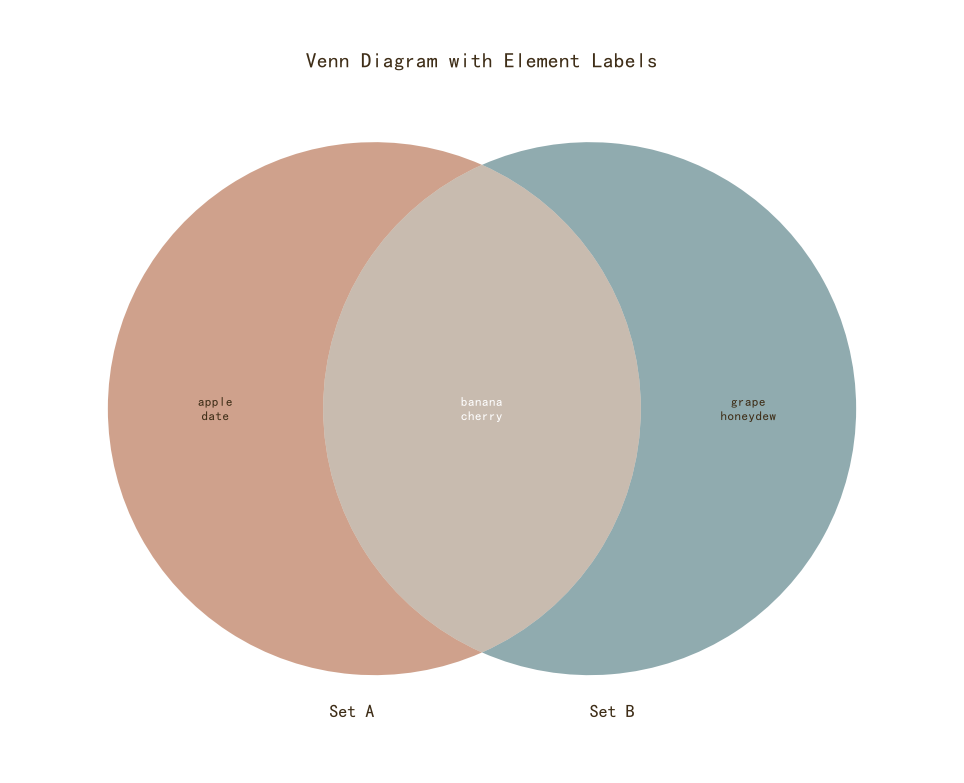
带自定义区域标注
Python51 行
import matplotlib.pyplot as plt
from matplotlib_venn import venn2

COLORS = ["#A8552E", "#35666E", "#D0A64F", "#3F2E18", "#7E8F52"]
BG = "#F7F3EC"

A = {"apple", "banana", "cherry", "date"}
B = {"banana", "cherry", "grape", "honeydew"}

only_a = A - B
only_b = B - A
both = A & B

fig, ax = plt.subplots(figsize=(9, 7.5))

v = venn2(
    [A, B],
    set_labels=("Set A", "Set B"),
    set_colors=(COLORS[0], COLORS[1]),
    alpha=0.55,
    ax=ax,
)

# 用具体元素替代数量
if v.get_label_by_id("10"):   # A only
    v.get_label_by_id("10").set_text("\n".join(sorted(only_a)))
    v.get_label_by_id("10").set_fontsize(9)
    v.get_label_by_id("10").set_color(COLORS[3])

if v.get_label_by_id("01"):   # B only
    v.get_label_by_id("01").set_text("\n".join(sorted(only_b)))
    v.get_label_by_id("01").set_fontsize(9)
    v.get_label_by_id("01").set_color(COLORS[3])

if v.get_label_by_id("11"):   # A∩B
    v.get_label_by_id("11").set_text("\n".join(sorted(both)))
    v.get_label_by_id("11").set_fontsize(9)
    v.get_label_by_id("11").set_color("white")
    v.get_label_by_id("11").set_fontweight("bold")

for text in v.set_labels:
    if text:
        text.set_color(COLORS[3])
        text.set_fontsize(13)
        text.set_fontweight("bold")

ax.set_title("Venn Diagram with Element Labels",
             fontsize=15, color=COLORS[3], pad=12)

plt.tight_layout()
plt.show()四集合
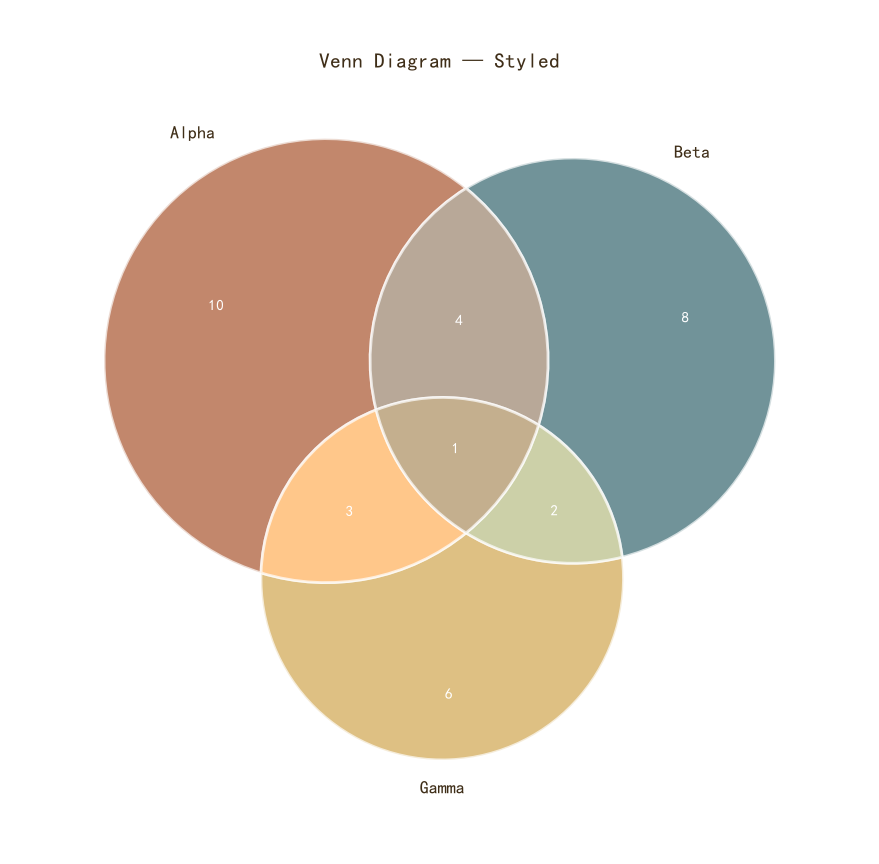
四集合
Python42 行
import matplotlib.pyplot as plt
from matplotlib_venn import venn3

COLORS = ["#A8552E", "#35666E", "#D0A64F", "#3F2E18", "#7E8F52"]
BG = "#F7F3EC"

# matplotlib-venn 不直接支持 venn4,4 集合推荐用 upsetplot
# 这里演示 3 集合带更多样式的版本

fig, ax = plt.subplots(figsize=(9, 8))

v = venn3(
    subsets=(10, 8, 4, 6, 3, 2, 1),
    set_labels=("Alpha", "Beta", "Gamma"),
    set_colors=(COLORS[0], COLORS[1], COLORS[2]),
    alpha=0.7,
    ax=ax,
)

# 边框加粗
for patch in v.patches:
    if patch:
        patch.set_edgecolor("white")
        patch.set_linewidth(2.0)

for text in v.set_labels:
    if text:
        text.set_color(COLORS[3])
        text.set_fontsize(13)
        text.set_fontweight("bold")

for text in v.subset_labels:
    if text:
        text.set_color("white")
        text.set_fontsize(11)
        text.set_fontweight("bold")

ax.set_title("Venn Diagram — Styled",
             fontsize=15, color=COLORS[3], pad=12)

plt.tight_layout()
plt.show()UpSet Plot(4+ 集合的现代替代)
UpSet Plot(4+ 集合的现代替代)
Python33 行
import matplotlib.pyplot as plt
from upsetplot import from_contents, UpSet
import pandas as pd

COLORS = ["#A8552E", "#35666E", "#D0A64F", "#3F2E18", "#7E8F52"]
BG = "#F7F3EC"

# 四个集合
sets = {
    "Set A": {"a", "b", "c", "d", "e"},
    "Set B": {"b", "c", "f", "g"},
    "Set C": {"c", "d", "h", "i"},
    "Set D": {"c", "e", "g", "j"},
}

data = from_contents(sets)

fig = plt.figure(figsize=(10, 6))
fig.patch.set_facecolor(BG)

UpSet(
    data,
    subset_size="count",
    show_counts=True,
    facecolor=COLORS[0],
    other_dots_color=COLORS[3],
    shading_color=COLORS[2],
)

plt.suptitle("UpSet Plot — 4 Sets",
             fontsize=15, color=COLORS[3], y=1.02)
plt.tight_layout()
plt.show()