HIERARCHICAL EDGE BUNDLING
绘图 · 第 36 / 36 章
简化版层次边捆绑
(手写贝塞尔曲线)
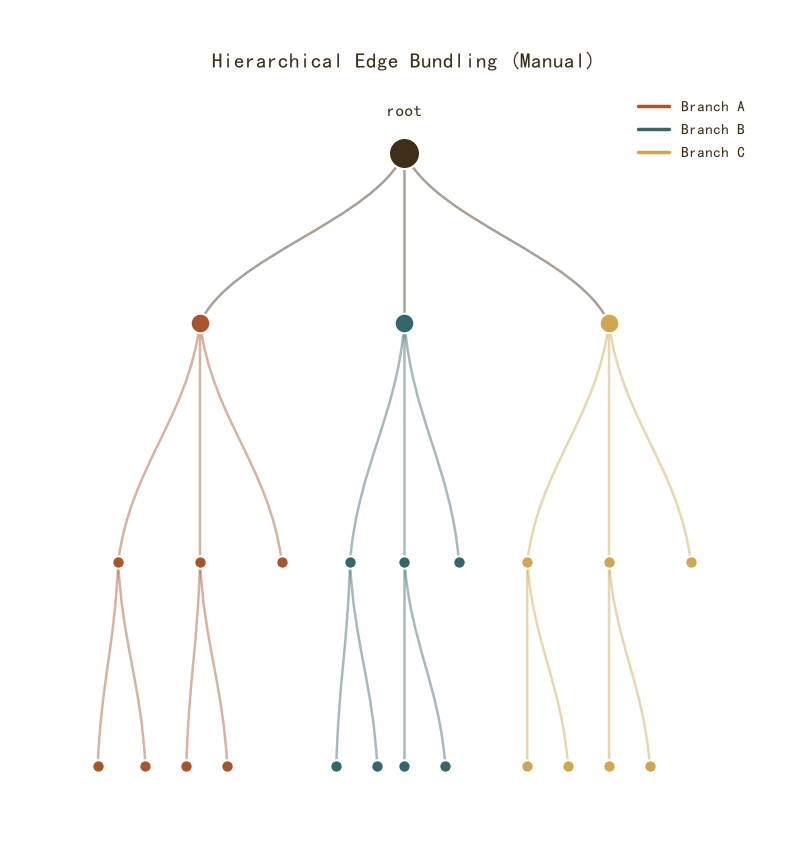
简化版层次边捆绑(手写贝塞尔曲线)
Python123 行
import matplotlib.pyplot as plt
import numpy as np
from matplotlib.patches import PathPatch
from matplotlib.path import Path

COLORS = ["#A8552E", "#35666E", "#D0A64F", "#3F2E18", "#7E8F52"]
BG = "#F7F3EC"

# 层次结构:树形布局
# 根节点 → 3 个分支 → 每个分支 3 个叶子
fig, ax = plt.subplots(figsize=(12, 8))

# 定义节点位置(手动布局,模拟树)
levels = {
    0: [("root", 0.5, 0.95)],
    1: [("A", 0.2, 0.7), ("B", 0.5, 0.7), ("C", 0.8, 0.7)],
    2: [
        ("A1", 0.08, 0.35), ("A2", 0.2, 0.35), ("A3", 0.32, 0.35),
        ("B1", 0.42, 0.35), ("B2", 0.5, 0.35), ("B3", 0.58, 0.35),
        ("C1", 0.68, 0.35), ("C2", 0.8, 0.35), ("C3", 0.92, 0.35),
    ],
    3: [
        ("A1a", 0.05, 0.05), ("A1b", 0.12, 0.05),
        ("A2a", 0.18, 0.05), ("A2b", 0.24, 0.05),
        ("B1a", 0.40, 0.05), ("B1b", 0.46, 0.05),
        ("B2a", 0.50, 0.05), ("B2b", 0.56, 0.05),
        ("C1a", 0.68, 0.05), ("C1b", 0.74, 0.05),
        ("C2a", 0.80, 0.05), ("C2b", 0.86, 0.05),
    ],
}

# 收集所有节点坐标
nodes = {}
for lvl, items in levels.items():
    for name, x, y in items:
        nodes[name] = (x, y)

# 定义边(父 → 子)
edges = [
    ("root", "A"), ("root", "B"), ("root", "C"),
    ("A", "A1"), ("A", "A2"), ("A", "A3"),
    ("B", "B1"), ("B", "B2"), ("B", "B3"),
    ("C", "C1"), ("C", "C2"), ("C", "C3"),
    ("A1", "A1a"), ("A1", "A1b"),
    ("A2", "A2a"), ("A2", "A2b"),
    ("B1", "B1a"), ("B1", "B1b"),
    ("B2", "B2a"), ("B2", "B2b"),
    ("C1", "C1a"), ("C1", "C1b"),
    ("C2", "C2a"), ("C2", "C2b"),
]

# 按顶层分支着色
def get_top_branch(node):
    if node in ("A", "A1", "A2", "A3", "A1a", "A1b", "A2a", "A2b"):
        return "A"
    if node in ("B", "B1", "B2", "B3", "B1a", "B1b", "B2a", "B2b"):
        return "B"
    if node in ("C", "C1", "C2", "C3", "C1a", "C1b", "C2a", "C2b"):
        return "C"
    return "root"

branch_colors = {"A": COLORS[0], "B": COLORS[1], "C": COLORS[2], "root": COLORS[3]}

# 画边捆绑:同父节点的子边在靠近父节点处收拢
for src, tgt in edges:
    x1, y1 = nodes[src]
    x2, y2 = nodes[tgt]
    branch = get_top_branch(src)
    c = branch_colors.get(branch, COLORS[3])

    # 贝塞尔曲线:控制点靠近父节点,让同父的边在父节点附近「捆」在一起
    # 控制点 1:靠近起点(父节点),水平偏移小
    cx1 = x1 + (x2 - x1) * 0.15
    cy1 = y1 - (y1 - y2) * 0.4
    # 控制点 2:靠近终点(子节点),垂直偏移
    cx2 = x2 - (x2 - x1) * 0.15
    cy2 = y2 + (y1 - y2) * 0.4

    path = Path(
        [(x1, y1), (cx1, cy1), (cx2, cy2), (x2, y2)],
        [Path.MOVETO, Path.CURVE4, Path.CURVE4, Path.CURVE4],
    )
    patch = PathPatch(
        path,
        facecolor="none",
        edgecolor=c,
        linewidth=1.8,
        alpha=0.45,
        zorder=2,
    )
    ax.add_patch(patch)

# 画节点
for name, (x, y) in nodes.items():
    branch = get_top_branch(name)
    c = branch_colors.get(branch, COLORS[3])
    # 根节点大,叶子小
    size = 500 if name == "root" else (200 if len(name) == 1 else 80)
    ax.scatter(x, y, s=size, color=c,
               edgecolor="white", linewidth=1.5,
               zorder=5)

# 根节点标签
ax.text(0.5, 1.0, "root", ha="center", va="bottom",
        fontsize=12, color=COLORS[3], fontweight="bold")

ax.set_xlim(-0.02, 1.02)
ax.set_ylim(-0.02, 1.05)
ax.set_aspect("equal")
ax.axis("off")

ax.set_title("Hierarchical Edge Bundling (Manual)",
             fontsize=15, color=COLORS[3], pad=12)

# 图例
from matplotlib.lines import Line2D
handles = [Line2D([0], [0], color=branch_colors[b], linewidth=2.5, label=f"Branch {b}")
           for b in ["A", "B", "C"]]
ax.legend(handles=handles, frameon=False, fontsize=11,
          labelcolor=COLORS[3], loc="upper right")

plt.tight_layout()
plt.show()圆形层次边捆绑
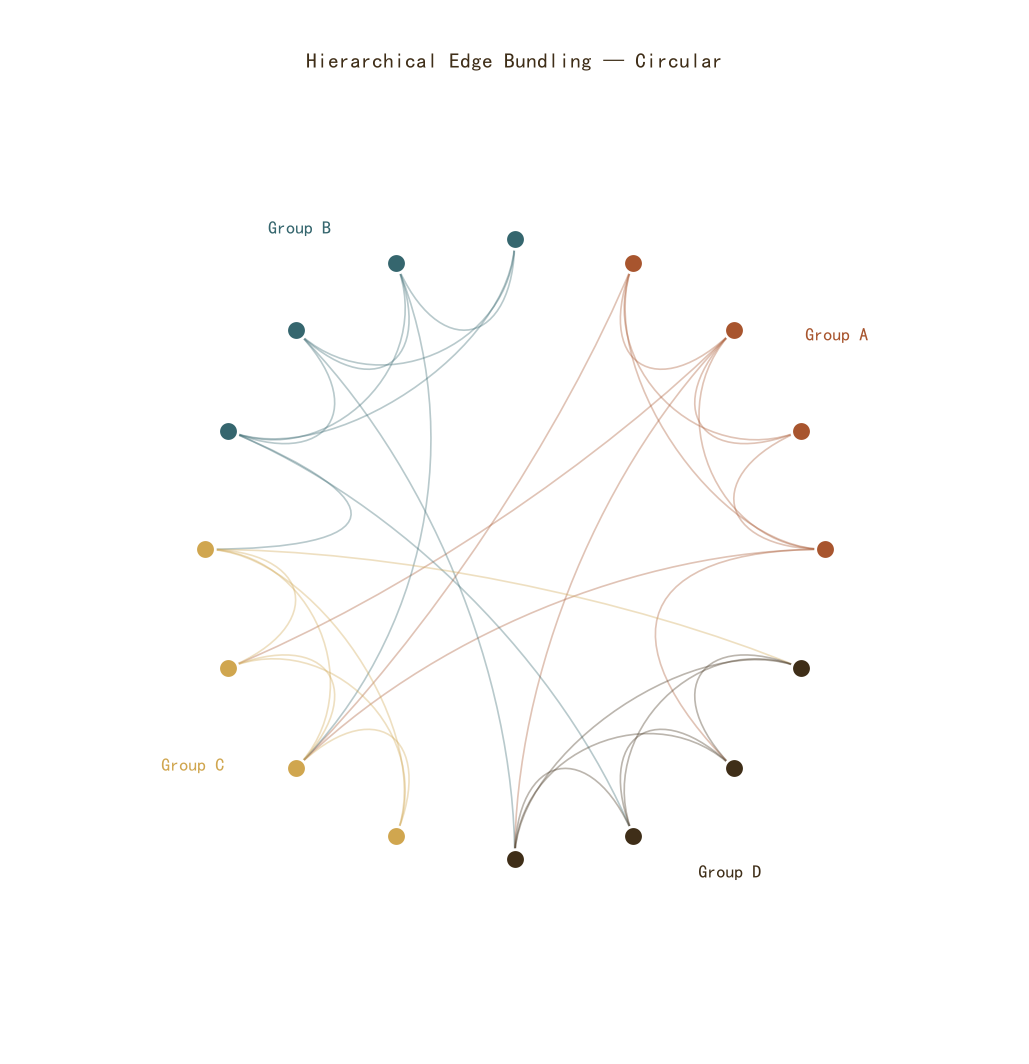
圆形层次边捆绑
Python93 行
import matplotlib.pyplot as plt
import numpy as np
from matplotlib.patches import PathPatch
from matplotlib.path import Path

COLORS = ["#A8552E", "#35666E", "#D0A64F", "#3F2E18", "#7E8F52"]
BG = "#F7F3EC"

np.random.seed(42)

# 层次结构:4 个大组,每组 4 个节点
n_groups = 4
n_per_group = 4
n_total = n_groups * n_per_group

# 节点在圆周上的角度
angles = np.linspace(0, 2 * np.pi, n_total, endpoint=False)
xs = np.cos(angles)
ys = np.sin(angles)

# 组颜色
group_colors = [COLORS[i] for i in range(n_groups)]
node_group = [i // n_per_group for i in range(n_total)]

fig, ax = plt.subplots(figsize=(10, 10))

# 画边:组内 + 跨组
# 组内边:所有同组节点两两相连
# 跨组边:随机连接
edges = []
for i in range(n_total):
    for j in range(i + 1, n_total):
        same_group = node_group[i] == node_group[j]
        if same_group:
            edges.append((i, j, True))       # 组内
        else:
            # 跨组:稀疏连接
            if np.random.random() < 0.08:
                edges.append((i, j, False))

# 按组着色画边
for i, j, same in edges:
    x1, y1 = xs[i], ys[i]
    x2, y2 = xs[j], ys[j]
    group = node_group[i]
    c = group_colors[group]

    # 控制点:向圆心方向收拢
    # 同组边收得更紧(控制点更靠近圆心)
    rad = 0.35 if same else 0.6
    cx1 = x1 * (1 - rad)
    cy1 = y1 * (1 - rad)
    cx2 = x2 * (1 - rad)
    cy2 = y2 * (1 - rad)

    path = Path(
        [(x1, y1), (cx1, cy1), (cx2, cy2), (x2, y2)],
        [Path.MOVETO, Path.CURVE4, Path.CURVE4, Path.CURVE4],
    )
    patch = PathPatch(
        path, facecolor="none", edgecolor=c,
        linewidth=1.2, alpha=0.35, zorder=2,
    )
    ax.add_patch(patch)

# 画节点
for i in range(n_total):
    c = group_colors[node_group[i]]
    ax.scatter(xs[i], ys[i], s=200, color=c,
               edgecolor="white", linewidth=2.0, zorder=5)

# 组标签
for g in range(n_groups):
    # 组的中心角度
    group_angles = angles[g * n_per_group:(g + 1) * n_per_group]
    mid_angle = np.mean(group_angles)
    lx = np.cos(mid_angle) * 1.25
    ly = np.sin(mid_angle) * 1.25
    ax.text(lx, ly, f"Group {chr(65 + g)}",
            ha="center", va="center",
            fontsize=13, color=group_colors[g],
            fontweight="bold")

ax.set_xlim(-1.5, 1.5)
ax.set_ylim(-1.5, 1.5)
ax.set_aspect("equal")
ax.axis("off")

ax.set_title("Hierarchical Edge Bundling — Circular",
             fontsize=15, color=COLORS[3], pad=12)

plt.tight_layout()
plt.show()