BUBBLE PLOT
绘图 · 第 10 / 36 章
基础气泡图
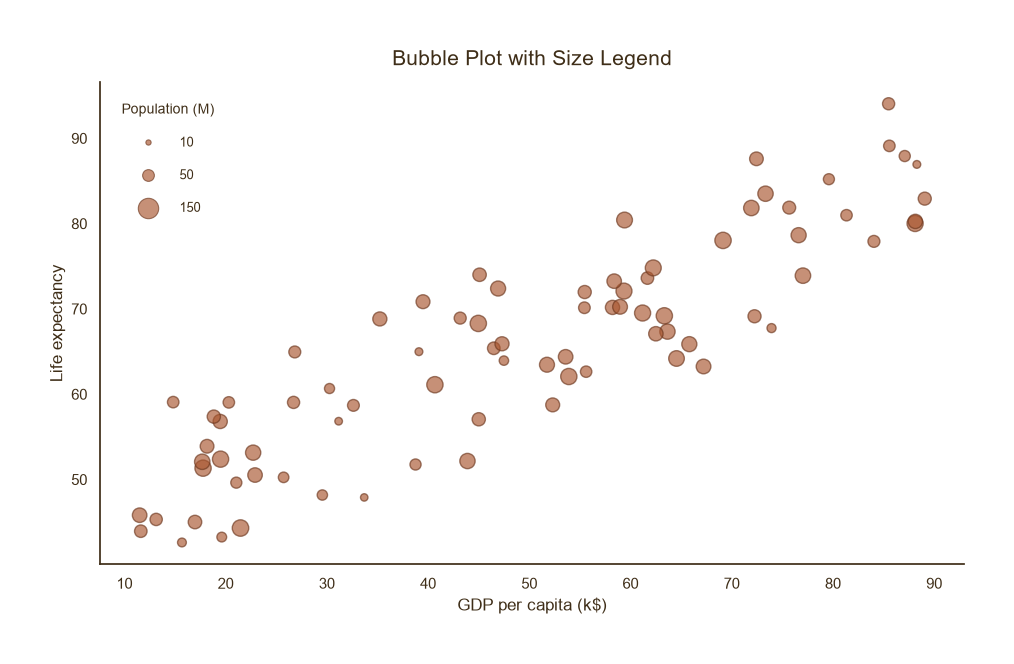
基础气泡图
Python59 行
import matplotlib.pyplot as plt
import numpy as np
from matplotlib.lines import Line2D
import matplotlib.colors as mcolors

COLORS = ["#A8552E", "#35666E", "#D0A64F", "#3F2E18", "#7E8F52"]

def darken(color, factor=0.65):
    """按比例调暗颜色,factor 越小越深"""
    r, g, b = mcolors.to_rgb(color)
    return (r * factor, g * factor, b * factor)

np.random.seed(0)
n = 80
x = np.random.uniform(10, 90, n)
y = 40 + 0.5 * x + np.random.normal(0, 6, n)
pop = np.random.uniform(5, 200, n)

fig, ax = plt.subplots(figsize=(9.5, 6))

s = np.sqrt(pop) * 10

edge = darken(COLORS[0], 0.65)   # 填充色的加深版本

ax.scatter(x, y, s=s, color=COLORS[0],
           edgecolor=edge, linewidth=1.0, alpha=0.65)

# ---- 大小图例(手工构造) ----
legend_sizes = [10, 50, 150]
legend_handles = [
    Line2D([0], [0], marker="o", color="none",
           markerfacecolor=COLORS[0], markeredgecolor=edge,
           markeredgewidth=0.8, alpha=0.65,
           markersize=np.sqrt(v) * 1.2,
           label=f"{v}")
    for v in legend_sizes
]
leg = ax.legend(
    handles=legend_handles,
    frameon=False, fontsize=9, labelcolor=COLORS[3],
    loc="upper left", labelspacing=1.6, borderpad=1.2,
    title="Population (M)", title_fontsize=10,
    handletextpad=1.5,
)
leg.get_title().set_color(COLORS[3])

ax.set_title("Bubble Plot with Size Legend",
             fontsize=15, color=COLORS[3], pad=12)
ax.set_xlabel("GDP per capita (k$)", fontsize=12, color=COLORS[3])
ax.set_ylabel("Life expectancy", fontsize=12, color=COLORS[3])
ax.tick_params(axis="both", colors=COLORS[3])

for sp in ("top", "right"):
    ax.spines[sp].set_visible(False)
ax.spines["left"].set_color(COLORS[3])
ax.spines["bottom"].set_color(COLORS[3])

plt.tight_layout()
plt.show()颜色 + 大小双编码
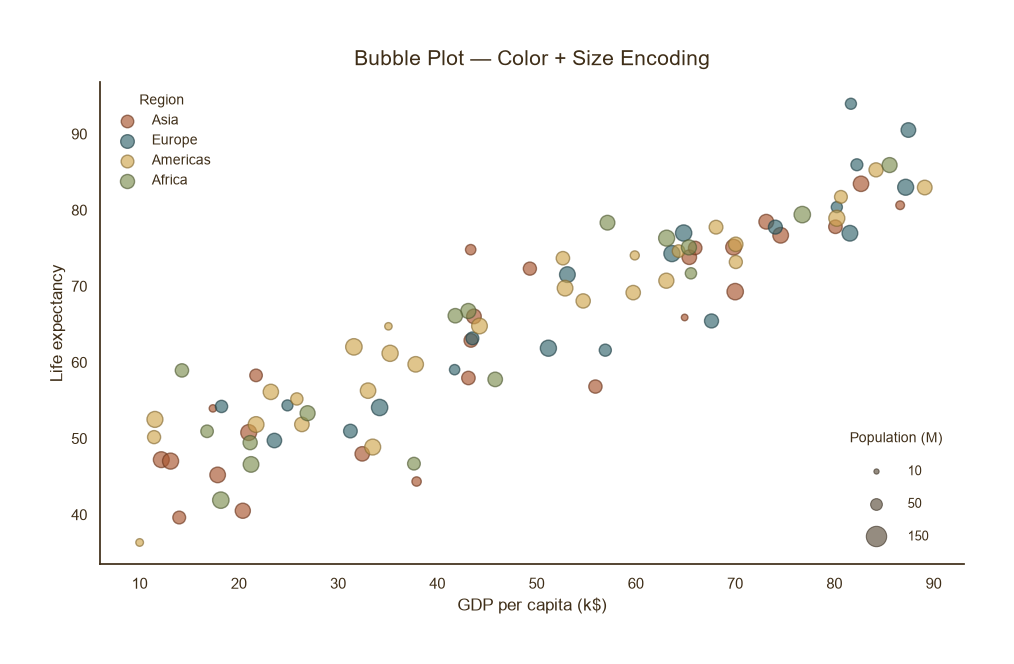
颜色 + 大小双编码
Python71 行
import matplotlib.pyplot as plt
import numpy as np
from matplotlib.lines import Line2D
import matplotlib.colors as mcolors

COLORS = ["#A8552E", "#35666E", "#D0A64F", "#3F2E18", "#7E8F52"]

def darken(color, factor=0.65):
    """按比例调暗颜色,factor 越小越深"""
    r, g, b = mcolors.to_rgb(color)
    return (r * factor, g * factor, b * factor)

np.random.seed(1)
n = 90
x = np.random.uniform(10, 90, n)
y = 40 + 0.5 * x + np.random.normal(0, 6, n)
pop = np.random.uniform(5, 200, n)
region = np.random.choice(["Asia", "Europe", "Americas", "Africa"], n)
region_color = {"Asia": COLORS[0], "Europe": COLORS[1],
                "Americas": COLORS[2], "Africa": COLORS[4]}

fig, ax = plt.subplots(figsize=(9.5, 6))

for reg, c in region_color.items():
    mask = region == reg
    edge = darken(c, 0.65)          # 该区域填充色的加深版本
    ax.scatter(x[mask], y[mask],
               s=np.sqrt(pop[mask]) * 10,
               color=c, edgecolor=edge,
               linewidth=1.0, alpha=0.65, label=reg)

# ---- 图例1:区域颜色 ----
leg1 = ax.legend(
    frameon=False, fontsize=10, labelcolor=COLORS[3],
    loc="upper left", title="Region", title_fontsize=10,
)
leg1.get_title().set_color(COLORS[3])
ax.add_artist(leg1)

# ---- 图例2:气泡大小 ----
legend_sizes = [10, 50, 150]
size_handles = [
    Line2D([0], [0], marker="o", color="none",
           markerfacecolor=COLORS[3], markeredgecolor=darken(COLORS[3], 0.65),
           markeredgewidth=0.8, alpha=0.55,
           markersize=np.sqrt(v) * 1.2,
           label=f"{v}")
    for v in legend_sizes
]
leg2 = ax.legend(
    handles=size_handles,
    frameon=False, fontsize=9, labelcolor=COLORS[3],
    loc="lower right", labelspacing=1.6, borderpad=1.2,
    title="Population (M)", title_fontsize=10,
    handletextpad=1.5,
)
leg2.get_title().set_color(COLORS[3])

ax.set_title("Bubble Plot — Color + Size Encoding",
             fontsize=15, color=COLORS[3], pad=12)
ax.set_xlabel("GDP per capita (k$)", fontsize=12, color=COLORS[3])
ax.set_ylabel("Life expectancy", fontsize=12, color=COLORS[3])
ax.tick_params(axis="both", colors=COLORS[3])

for sp in ("top", "right"):
    ax.spines[sp].set_visible(False)
ax.spines["left"].set_color(COLORS[3])
ax.spines["bottom"].set_color(COLORS[3])

plt.tight_layout()
plt.show()气泡大小映射连续变量
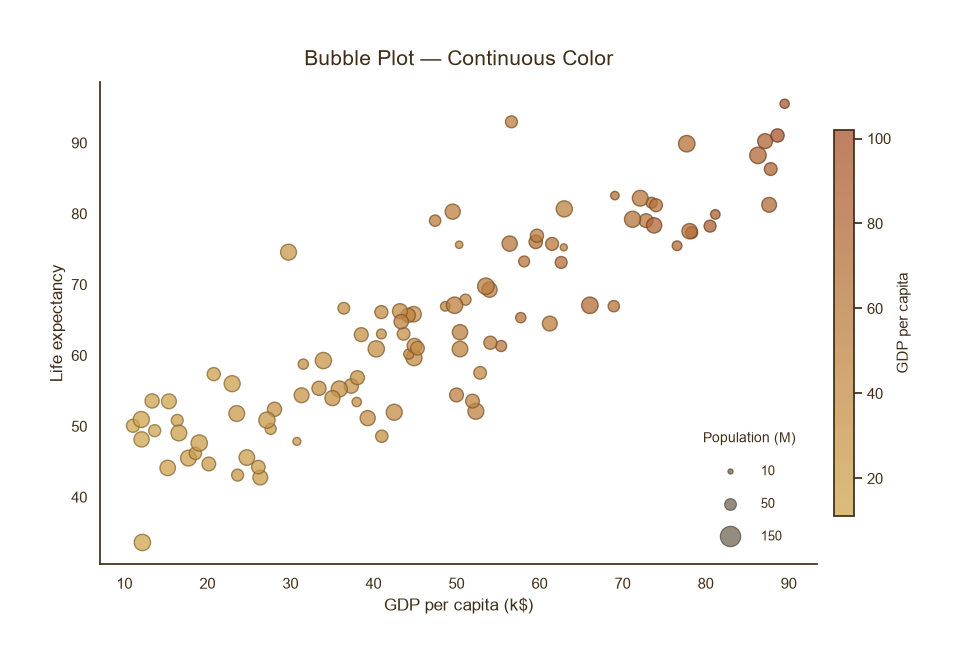
气泡大小映射连续变量
Python73 行
import matplotlib.pyplot as plt
import numpy as np
from matplotlib.colors import LinearSegmentedColormap, Normalize, to_rgb
from matplotlib.lines import Line2D

CMAP = LinearSegmentedColormap.from_list("theme", ["#D0A64F", "#A8552E"], N=256)


def darken(color, factor=0.65):
    """把颜色按比例调暗,factor 越小越深"""
    r, g, b = to_rgb(color)[:3]
    return (r * factor, g * factor, b * factor)


np.random.seed(2)
n = 100
x = np.random.uniform(10, 90, n)
y = 40 + 0.5 * x + np.random.normal(0, 6, n)
pop = np.random.uniform(5, 200, n)
gdp_pc = x * np.random.uniform(0.8, 1.2, n)

fig, ax = plt.subplots(figsize=(9.5, 6))

# 手动建立归一化,方便逐点取色
norm = Normalize(vmin=gdp_pc.min(), vmax=gdp_pc.max())
face_colors = CMAP(norm(gdp_pc))                 # 每个点的填充色 (RGBA)
edge_colors = [darken(c, 0.65) for c in face_colors]   # 逐点加深的边框色

sc = ax.scatter(x, y,
                s=np.sqrt(pop) * 10,
                c=gdp_pc,
                cmap=CMAP,
                norm=norm,
                edgecolor=edge_colors,           # 逐点加深的边框
                linewidth=1.0, alpha=0.75)

cbar = fig.colorbar(sc, ax=ax, shrink=0.8, pad=0.02)
cbar.set_label("GDP per capita", fontsize=11, color="#3F2E18")
cbar.ax.tick_params(colors="#3F2E18")
cbar.outline.set_edgecolor("#3F2E18")

# 大小图例(用主题深色 + 对应加深边框)
legend_sizes = [10, 50, 150]
theme_edge = darken("#3F2E18", 0.65)
size_handles = [
    Line2D([0], [0], marker="o", color="none",
           markerfacecolor="#3F2E18", markeredgecolor=theme_edge,
           markeredgewidth=0.8, alpha=0.55,
           markersize=np.sqrt(v) * 1.2, label=f"{v}")
    for v in legend_sizes
]
leg = ax.legend(
    handles=size_handles,
    frameon=False, fontsize=9, labelcolor="#3F2E18",
    loc="lower right", labelspacing=1.6, borderpad=1.2,
    title="Population (M)", title_fontsize=10,
    handletextpad=1.5,
)
leg.get_title().set_color("#3F2E18")

ax.set_title("Bubble Plot — Continuous Color",
             fontsize=15, color="#3F2E18", pad=12)
ax.set_xlabel("GDP per capita (k$)", fontsize=12, color="#3F2E18")
ax.set_ylabel("Life expectancy", fontsize=12, color="#3F2E18")
ax.tick_params(axis="both", colors="#3F2E18")

for sp in ("top", "right"):
    ax.spines[sp].set_visible(False)
ax.spines["left"].set_color("#3F2E18")
ax.spines["bottom"].set_color("#3F2E18")

plt.tight_layout()
plt.show()