3D SCATTER / SURFACE
绘图 · 第 11 / 36 章
3D 散点图
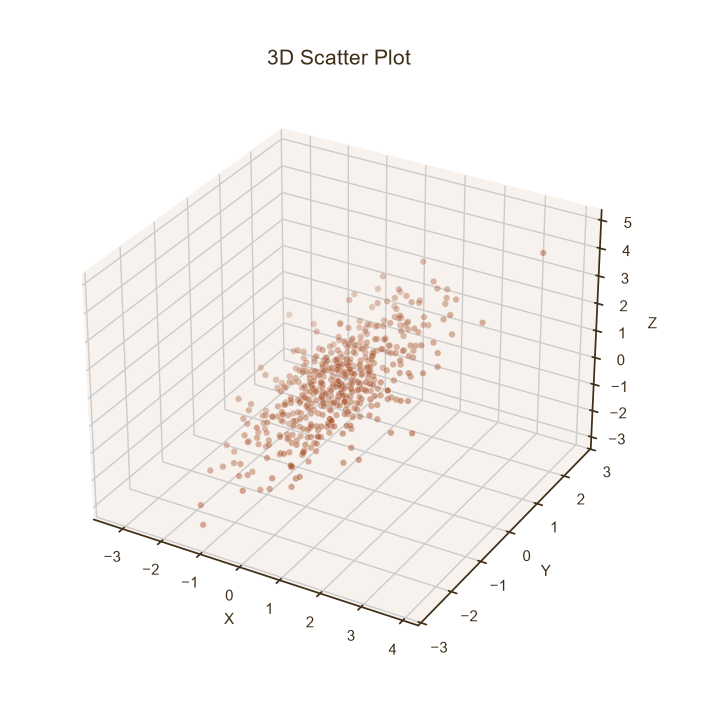
3D 散点图
Python31 行
import matplotlib.pyplot as plt
import numpy as np

COLORS = ["#A8552E", "#35666E", "#D0A64F", "#3F2E18", "#7E8F52"]
BG = "#F7F3EC"

np.random.seed(42)
n = 500
x = np.random.normal(0, 1, n)
y = np.random.normal(0, 1, n)
z = 0.8 * x + 0.5 * y + np.random.normal(0, 0.5, n)

fig = plt.figure(figsize=(8, 6.5))
ax = fig.add_subplot(111, projection="3d")

ax.scatter(x, y, z, s=22, color=COLORS[0],
           edgecolor="white", linewidth=0.3, alpha=0.75)

ax.set_title("3D Scatter Plot", fontsize=15, color=COLORS[3], pad=14)
ax.set_xlabel("X", fontsize=11, color=COLORS[3])
ax.set_ylabel("Y", fontsize=11, color=COLORS[3])
ax.set_zlabel("Z", fontsize=11, color=COLORS[3])
ax.tick_params(axis="both", colors=COLORS[3])

# 3D 坐标轴边框配色
ax.xaxis.set_pane_color((0.97, 0.95, 0.93, 1.0))
ax.yaxis.set_pane_color((0.97, 0.95, 0.93, 1.0))
ax.zaxis.set_pane_color((0.97, 0.95, 0.93, 1.0))

plt.tight_layout()
plt.show()3D 散点 + 颜色编码
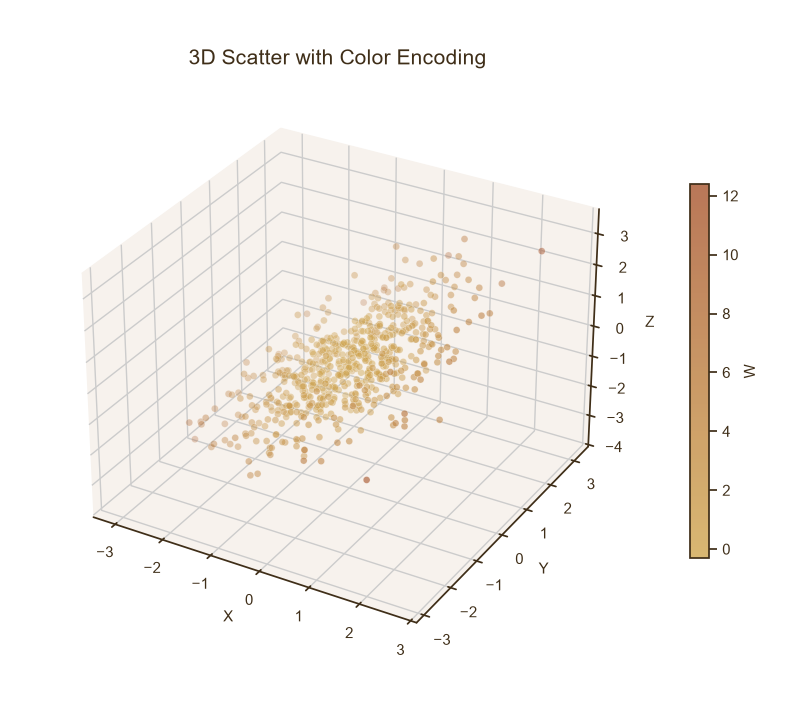
3D 散点 + 颜色编码
Python37 行
import matplotlib.pyplot as plt
import numpy as np
from matplotlib.colors import LinearSegmentedColormap

CMAP = LinearSegmentedColormap.from_list("theme", ["#D0A64F", "#A8552E"], N=256)

np.random.seed(0)
n = 600
x = np.random.normal(0, 1, n)
y = np.random.normal(0, 1, n)
z = 0.8 * x + 0.5 * y + np.random.normal(0, 0.5, n)
w = x ** 2 + y ** 2 + np.random.normal(0, 0.2, n)   # 第四变量

fig = plt.figure(figsize=(8.5, 6.5))
ax = fig.add_subplot(111, projection="3d")

sc = ax.scatter(x, y, z, c=w, cmap=CMAP,
                s=25, edgecolor="white",
                linewidth=0.3, alpha=0.8)

cbar = fig.colorbar(sc, ax=ax, shrink=0.65, pad=0.08)
cbar.set_label("W", fontsize=11, color="#3F2E18")
cbar.ax.tick_params(colors="#3F2E18")
cbar.outline.set_edgecolor("#3F2E18")

ax.set_title("3D Scatter with Color Encoding",
             fontsize=15, color="#3F2E18", pad=14)
ax.set_xlabel("X", fontsize=11, color="#3F2E18")
ax.set_ylabel("Y", fontsize=11, color="#3F2E18")
ax.set_zlabel("Z", fontsize=11, color="#3F2E18")
ax.tick_params(axis="both", colors="#3F2E18")

for pane in (ax.xaxis, ax.yaxis, ax.zaxis):
    pane.set_pane_color((0.97, 0.95, 0.93, 1.0))

plt.tight_layout()
plt.show()3D 散点 + 分类着色
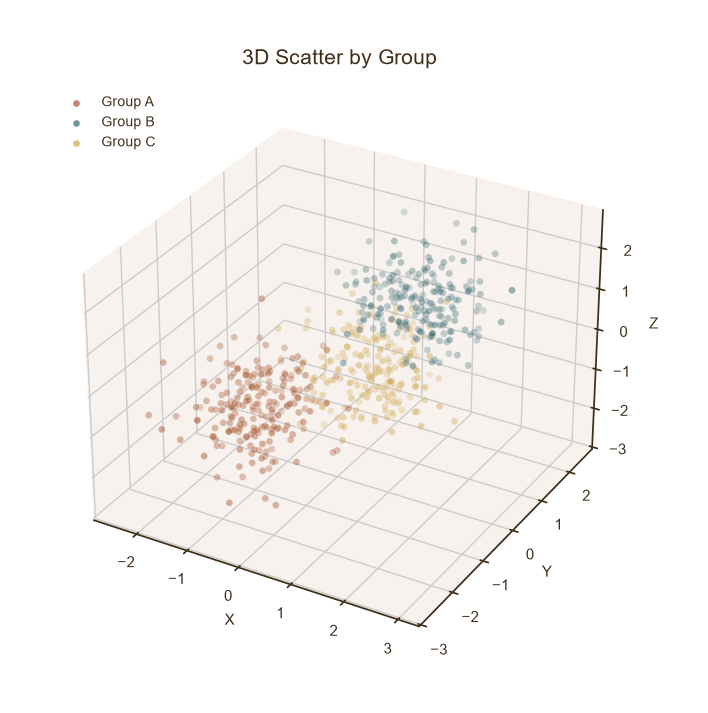
3D 散点 + 分类着色
Python41 行
import matplotlib.pyplot as plt
import numpy as np

COLORS = ["#A8552E", "#35666E", "#D0A64F", "#3F2E18", "#7E8F52"]

np.random.seed(1)
groups = {
    "Group A": (np.random.normal(-1, 0.6, 200),
                np.random.normal(-1, 0.6, 200),
                np.random.normal(-1, 0.6, 200)),
    "Group B": (np.random.normal(1, 0.6, 200),
                np.random.normal(1, 0.6, 200),
                np.random.normal(1, 0.6, 200)),
    "Group C": (np.random.normal(0, 0.6, 200),
                np.random.normal(1, 0.6, 200),
                np.random.normal(-1, 0.6, 200)),
}

fig = plt.figure(figsize=(8.5, 6.5))
ax = fig.add_subplot(111, projection="3d")

for (name, (x, y, z)), c in zip(groups.items(), COLORS):
    ax.scatter(x, y, z, s=25, color=c,
               edgecolor="white", linewidth=0.3,
               alpha=0.7, label=name)

ax.set_title("3D Scatter by Group", fontsize=15,
             color=COLORS[3], pad=14)
ax.set_xlabel("X", fontsize=11, color=COLORS[3])
ax.set_ylabel("Y", fontsize=11, color=COLORS[3])
ax.set_zlabel("Z", fontsize=11, color=COLORS[3])
ax.tick_params(axis="both", colors=COLORS[3])

ax.legend(frameon=False, fontsize=10, labelcolor=COLORS[3],
          loc="upper left")

for pane in (ax.xaxis, ax.yaxis, ax.zaxis):
    pane.set_pane_color((0.97, 0.95, 0.93, 1.0))

plt.tight_layout()
plt.show()3D 曲面图
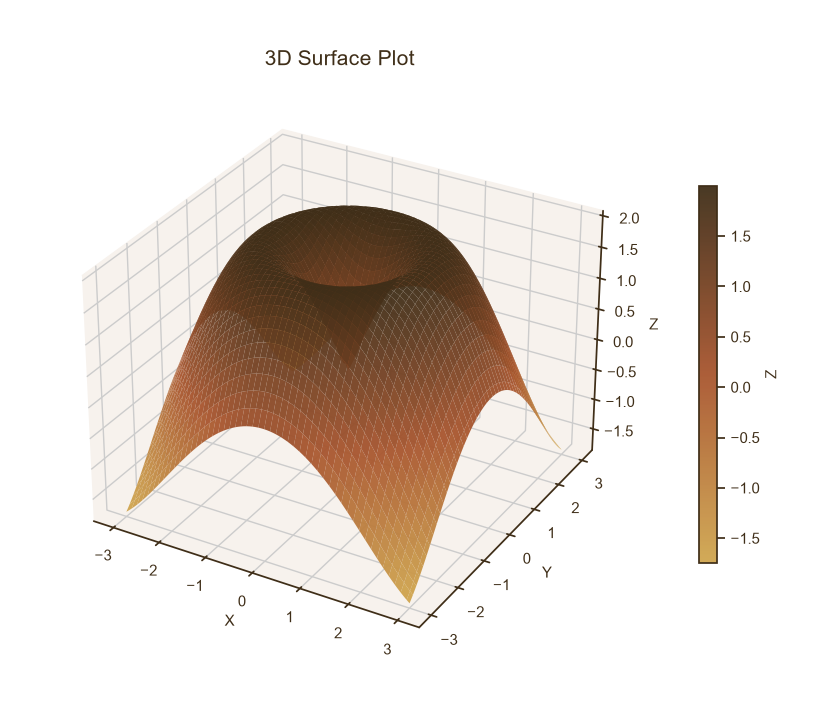
3D 曲面图
Python43 行
import matplotlib.pyplot as plt
import numpy as np
from matplotlib.colors import LinearSegmentedColormap

CMAP = LinearSegmentedColormap.from_list(
    "theme", ["#D0A64F", "#A8552E", "#3F2E18"], N=256
)

# 网格
x = np.linspace(-3, 3, 100)
y = np.linspace(-3, 3, 100)
X, Y = np.meshgrid(x, y)
Z = np.sin(np.sqrt(X**2 + Y**2)) * 2   # 波纹曲面

fig = plt.figure(figsize=(9, 6.5))
ax = fig.add_subplot(111, projection="3d")

surf = ax.plot_surface(
    X, Y, Z,
    cmap=CMAP,
    edgecolor="none",
    linewidth=0,
    antialiased=True,
    rstride=2, cstride=2,      # 采样步长,越小越精细也越慢
    alpha=0.95,
)

cbar = fig.colorbar(surf, ax=ax, shrink=0.65, pad=0.08)
cbar.set_label("Z", fontsize=11, color="#3F2E18")
cbar.ax.tick_params(colors="#3F2E18")
cbar.outline.set_edgecolor("#3F2E18")

ax.set_title("3D Surface Plot", fontsize=15, color="#3F2E18", pad=14)
ax.set_xlabel("X", fontsize=11, color="#3F2E18")
ax.set_ylabel("Y", fontsize=11, color="#3F2E18")
ax.set_zlabel("Z", fontsize=11, color="#3F2E18")
ax.tick_params(axis="both", colors="#3F2E18")

for pane in (ax.xaxis, ax.yaxis, ax.zaxis):
    pane.set_pane_color((0.97, 0.95, 0.93, 1.0))

plt.tight_layout()
plt.show()曲面 + 等高线投影
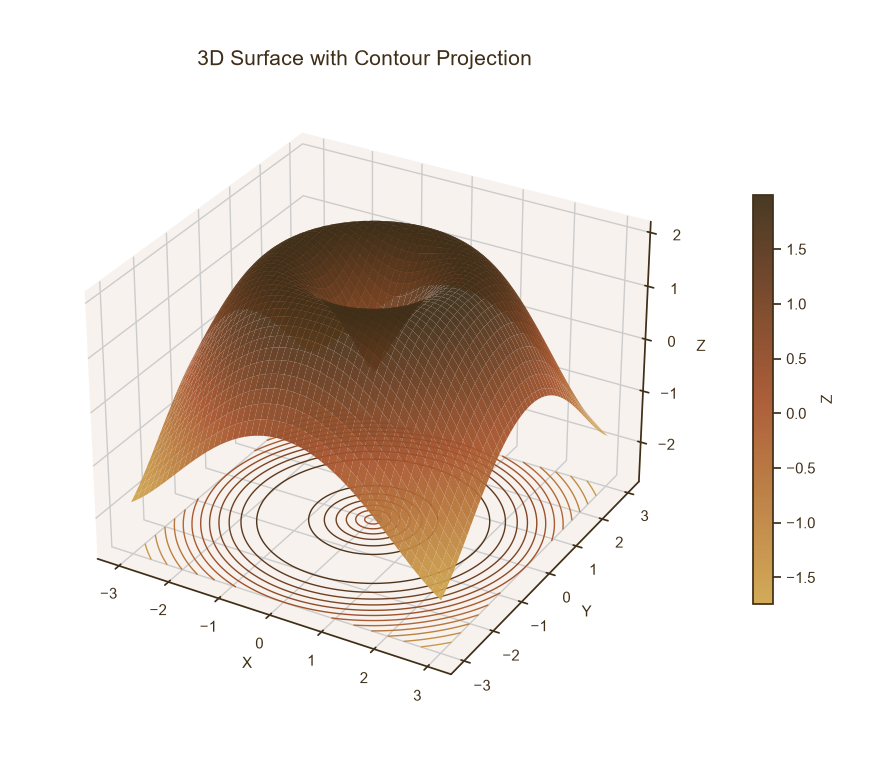
曲面 + 等高线投影
Python46 行
import matplotlib.pyplot as plt
import numpy as np
from matplotlib.colors import LinearSegmentedColormap

BG = "#F7F3EC"
CMAP = LinearSegmentedColormap.from_list(
    "theme", ["#D0A64F", "#A8552E", "#3F2E18"], N=256
)

x = np.linspace(-3, 3, 100)
y = np.linspace(-3, 3, 100)
X, Y = np.meshgrid(x, y)
Z = np.sin(np.sqrt(X**2 + Y**2)) * 2

fig = plt.figure(figsize=(9.5, 7))
ax = fig.add_subplot(111, projection="3d")

# 主曲面
surf = ax.plot_surface(X, Y, Z, cmap=CMAP,
                       edgecolor="none", alpha=0.95,
                       rstride=2, cstride=2)

# 底部等高线投影(offset 放到 z 最低处)
z_min = Z.min() - 1
ax.contour(X, Y, Z, zdir="z", offset=z_min,
           cmap=CMAP, levels=12, linewidths=1.0)

cbar = fig.colorbar(surf, ax=ax, shrink=0.65, pad=0.08)
cbar.set_label("Z", fontsize=11, color="#3F2E18")
cbar.ax.tick_params(colors="#3F2E18")
cbar.outline.set_edgecolor("#3F2E18")

ax.set_zlim(z_min, Z.max() * 1.1)

ax.set_title("3D Surface with Contour Projection",
             fontsize=15, color="#3F2E18", pad=14)
ax.set_xlabel("X", fontsize=11, color="#3F2E18")
ax.set_ylabel("Y", fontsize=11, color="#3F2E18")
ax.set_zlabel("Z", fontsize=11, color="#3F2E18")
ax.tick_params(axis="both", colors="#3F2E18")

for pane in (ax.xaxis, ax.yaxis, ax.zaxis):
    pane.set_pane_color((0.97, 0.95, 0.93, 1.0))

plt.tight_layout()
plt.show()带线框的曲面
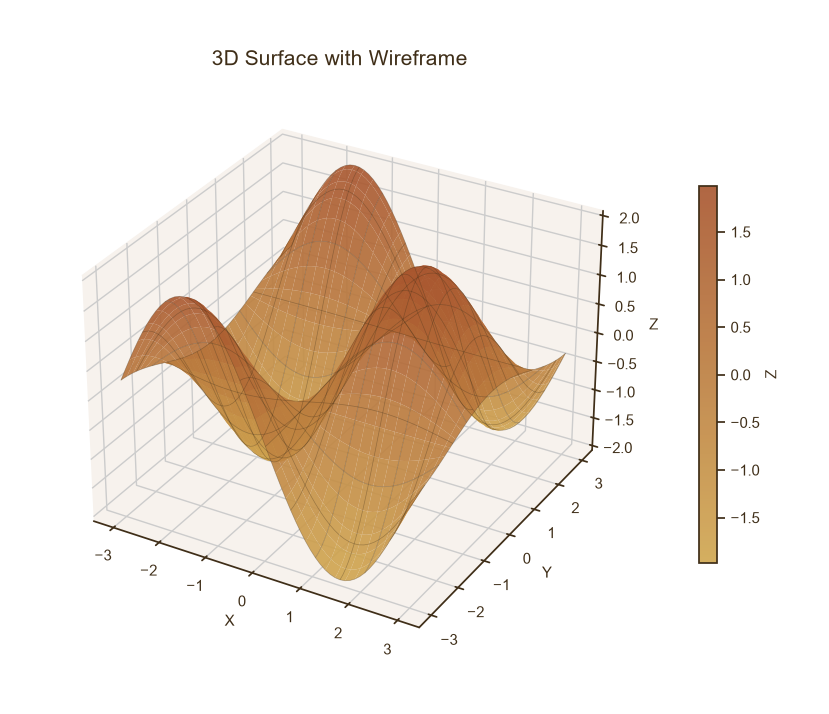
带线框的曲面
Python43 行
import matplotlib.pyplot as plt
import numpy as np
from matplotlib.colors import LinearSegmentedColormap

BG = "#F7F3EC"
CMAP = LinearSegmentedColormap.from_list(
    "theme", ["#D0A64F", "#A8552E"], N=256
)

x = np.linspace(-3, 3, 60)
y = np.linspace(-3, 3, 60)
X, Y = np.meshgrid(x, y)
Z = np.sin(X) * np.cos(Y) * 2

fig = plt.figure(figsize=(9, 6.5))
ax = fig.add_subplot(111, projection="3d")

surf = ax.plot_surface(X, Y, Z, cmap=CMAP,
                       edgecolor="none", alpha=0.9)

# 线框叠加
ax.plot_wireframe(X, Y, Z,
                  rstride=5, cstride=5,
                  color="#3F2E18", linewidth=0.5,
                  alpha=0.35)

cbar = fig.colorbar(surf, ax=ax, shrink=0.65, pad=0.08)
cbar.set_label("Z", fontsize=11, color="#3F2E18")
cbar.ax.tick_params(colors="#3F2E18")
cbar.outline.set_edgecolor("#3F2E18")

ax.set_title("3D Surface with Wireframe",
             fontsize=15, color="#3F2E18", pad=14)
ax.set_xlabel("X", fontsize=11, color="#3F2E18")
ax.set_ylabel("Y", fontsize=11, color="#3F2E18")
ax.set_zlabel("Z", fontsize=11, color="#3F2E18")
ax.tick_params(axis="both", colors="#3F2E18")

for pane in (ax.xaxis, ax.yaxis, ax.zaxis):
    pane.set_pane_color((0.97, 0.95, 0.93, 1.0))

plt.tight_layout()
plt.show()