STACKEDAREA PLOT
绘图 · 第 12 / 36 章
基础堆叠面积图
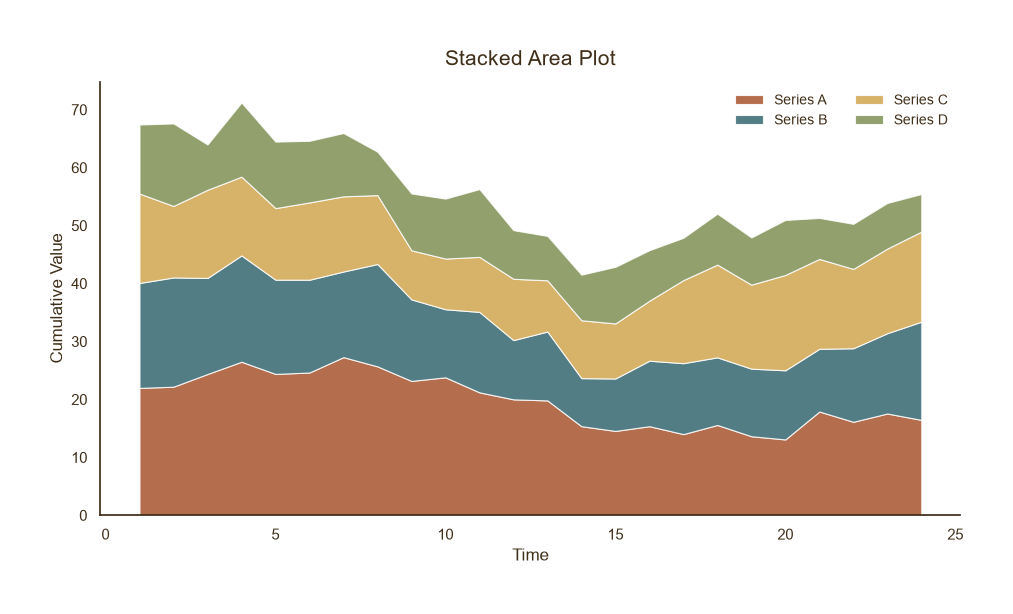
基础堆叠面积图
Python40 行
import matplotlib.pyplot as plt
import numpy as np

COLORS = ["#A8552E", "#35666E", "#D0A64F", "#7E8F52", "#3F2E18"]
BG = "#F7F3EC"

np.random.seed(42)
x = np.arange(1, 25)
series = {
    "Series A": 20 + 5 * np.sin(x / 4) + np.random.normal(0, 1.5, len(x)),
    "Series B": 15 + 4 * np.cos(x / 5) + np.random.normal(0, 1.5, len(x)),
    "Series C": 12 + 3 * np.sin(x / 3 + 1) + np.random.normal(0, 1.5, len(x)),
    "Series D": 10 + 2 * np.cos(x / 6) + np.random.normal(0, 1.5, len(x)),
}

fig, ax = plt.subplots(figsize=(9.5, 5.5))

ax.stackplot(
    x, *series.values(),
    labels=list(series.keys()),
    colors=COLORS[:len(series)],
    alpha=0.85,
    edgecolor="white",
    linewidth=0.8,
)

ax.set_title("Stacked Area Plot", fontsize=15, color=COLORS[4], pad=12)
ax.set_xlabel("Time", fontsize=12, color=COLORS[4])
ax.set_ylabel("Cumulative Value", fontsize=12, color=COLORS[4])
ax.tick_params(axis="both", colors=COLORS[4])
ax.legend(frameon=False, fontsize=10, labelcolor=COLORS[4],
          loc="upper right", ncol=2)

for s in ("top", "right"):
    ax.spines[s].set_visible(False)
ax.spines["left"].set_color(COLORS[4])
ax.spines["bottom"].set_color(COLORS[4])

plt.tight_layout()
plt.show()百分比堆叠
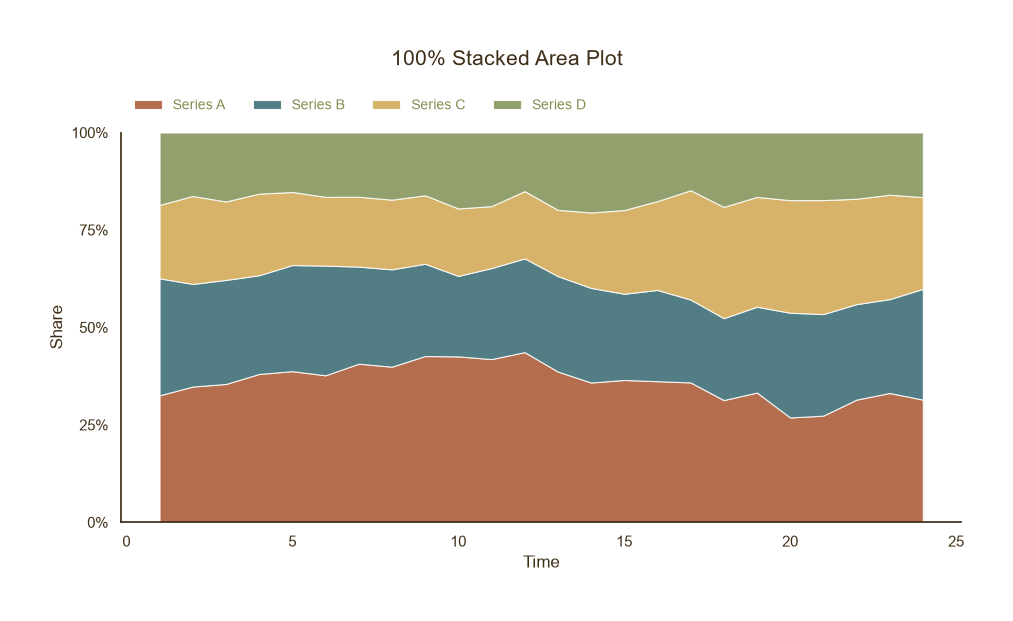
百分比堆叠
Python64 行
import matplotlib.pyplot as plt
import numpy as np

COLORS = ["#A8552E", "#35666E", "#D0A64F", "#7E8F52", "#3F2E18"]
BG = "#F7F3EC"

np.random.seed(0)
x = np.arange(1, 25)
series = {
    "Series A": 20 + 5 * np.sin(x / 4) + np.random.normal(0, 1, len(x)),
    "Series B": 15 + 4 * np.cos(x / 5) + np.random.normal(0, 1, len(x)),
    "Series C": 12 + 3 * np.sin(x / 3 + 1) + np.random.normal(0, 1, len(x)),
    "Series D": 10 + 2 * np.cos(x / 6) + np.random.normal(0, 1, len(x)),
}

# 取绝对值再归一化到 100%
data = np.array([np.abs(v) for v in series.values()])
data_pct = data / data.sum(axis=0) * 100

fig, ax = plt.subplots(figsize=(9.5, 5.5))

ax.stackplot(
    x, *data_pct,
    labels=list(series.keys()),
    colors=COLORS[:len(series)],
    alpha=0.85,
    edgecolor="white",
    linewidth=0.8,
)

ax.set_ylim(0, 100)
ax.set_yticks([0, 25, 50, 75, 100])
ax.set_yticklabels(["0%", "25%", "50%", "75%", "100%"])

ax.set_xlabel("Time", fontsize=12, color=COLORS[4])
ax.set_ylabel("Share", fontsize=12, color=COLORS[4])
ax.tick_params(axis="both", colors=COLORS[4])

ax.legend(
    frameon=False, fontsize=10, labelcolor=COLORS[4],
    loc="lower center",
    bbox_to_anchor=(0.5, 1.02),   # 放到标题下方、坐标区上方
    ncol=4,
)
# 标题放到 figure 顶部
fig.suptitle("100% Stacked Area Plot", fontsize=15, color=COLORS[4], y=0.98)

# 图例放到坐标区上方(标题下方)
ax.legend(
    frameon=False, fontsize=10, labelcolor=COLORS[3],
    loc="lower left",
    bbox_to_anchor=(0, 1.02),
    ncol=4,
)

# 关键:给顶部留出空间
plt.tight_layout(rect=[0, 0, 1, 0.92])   # 顶部留 8% 给标题+图例
for s in ("top", "right"):
    ax.spines[s].set_visible(False)
ax.spines["left"].set_color(COLORS[4])
ax.spines["bottom"].set_color(COLORS[4])

plt.tight_layout()
plt.show()