STREAMGRAPH
绘图 · 第 13 / 36 章
基础流图
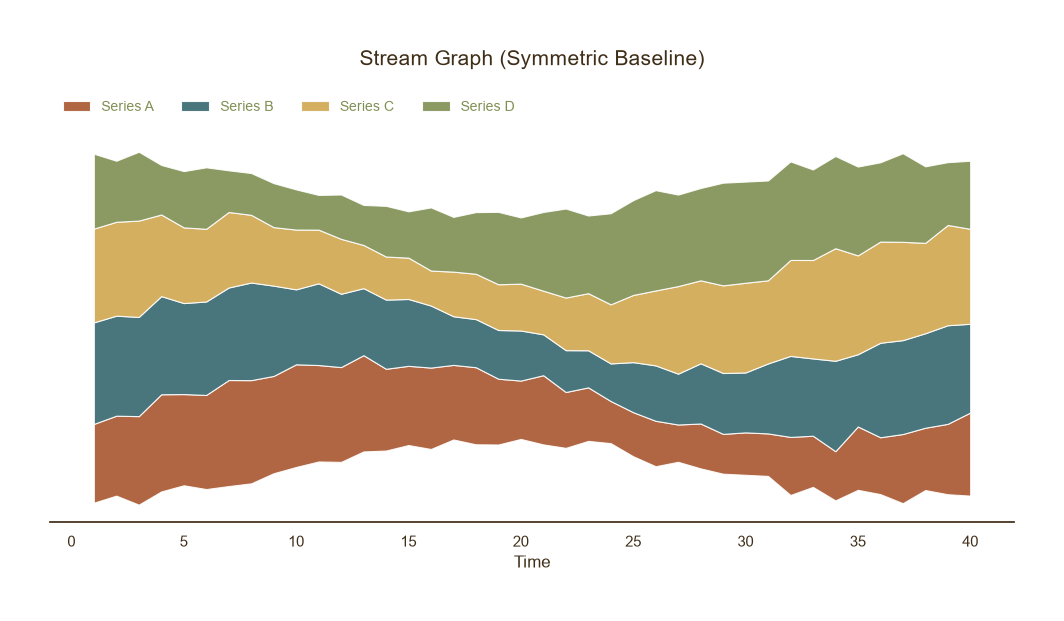
基础流图
Python51 行
import matplotlib.pyplot as plt
import numpy as np

COLORS = ["#A8552E", "#35666E", "#D0A64F", "#7E8F52", "#3F2E18"]
BG = "#F7F3EC"

np.random.seed(42)
x = np.arange(1, 41)
series = np.array([
    20 + 8 * np.sin(x / 6 + i) + np.random.normal(0, 1.5, len(x))
    for i in range(4)
])
series = np.abs(series)   # 保证非负

fig, ax = plt.subplots(figsize=(10, 5.5))

# 对称基线:整列总量的一半取负
baseline = -series.sum(axis=0) / 2

ax.stackplot(
    x, *series,
    baseline='sym',          # 字符串,不是数组
    labels=[f"Series {chr(65+i)}" for i in range(len(series))],
    colors=COLORS[:len(series)],
    alpha=0.9,
    edgecolor="white",
    linewidth=0.8,
)

fig.suptitle("Stream Graph (Symmetric Baseline)",
             fontsize=15, color=COLORS[4],y=0.98)
ax.set_xlabel("Time", fontsize=12, color=COLORS[4])
ax.set_ylabel("")
ax.tick_params(axis="x", colors=COLORS[4])
ax.set_yticks([])                             # 流图通常隐藏 y 轴


# 图例放到坐标区上方(标题下方)
ax.legend(
    frameon=False, fontsize=10, labelcolor=COLORS[3],
    loc="lower left",
    bbox_to_anchor=(0, 1.02),
    ncol=4,
)

for s in ("top", "right", "left"):
    ax.spines[s].set_visible(False)
ax.spines["bottom"].set_color(COLORS[4])

plt.tight_layout()
plt.show()wiggle 基线
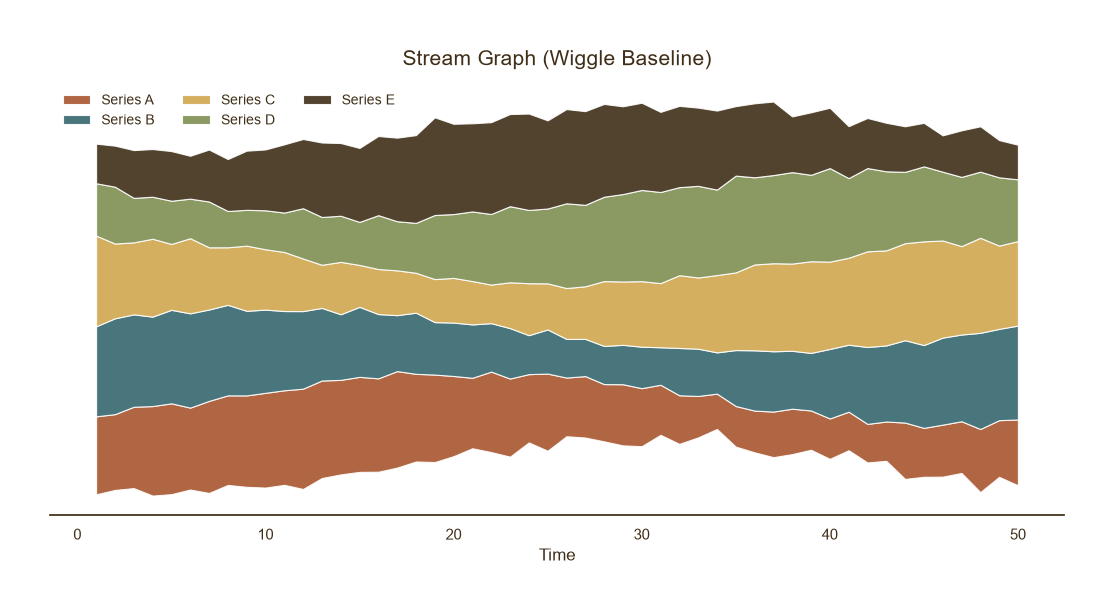
wiggle 基线
Python39 行
import matplotlib.pyplot as plt
import numpy as np

COLORS = ["#A8552E", "#35666E", "#D0A64F", "#7E8F52", "#3F2E18"]
BG = "#F7F3EC"

np.random.seed(0)
x = np.arange(1, 51)
series = np.abs(np.array([
    25 + 10 * np.sin(x / 8 + i * 1.2) + np.random.normal(0, 1.5, len(x))
    for i in range(5)
]))

fig, ax = plt.subplots(figsize=(10.5, 5.5))

ax.stackplot(
    x, *series,
    baseline="wiggle",                         # 关键:最小化摆动
    labels=[f"Series {chr(65+i)}" for i in range(len(series))],
    colors=COLORS[:len(series)],
    alpha=0.9,
    edgecolor="white",
    linewidth=0.8,
)

ax.set_title("Stream Graph (Wiggle Baseline)",
             fontsize=15, color=COLORS[4], pad=12)
ax.set_xlabel("Time", fontsize=12, color=COLORS[4])
ax.tick_params(axis="x", colors=COLORS[4])
ax.set_yticks([])
ax.legend(frameon=False, fontsize=10, labelcolor=COLORS[4],
          loc="upper left", ncol=3)

for s in ("top", "right", "left"):
    ax.spines[s].set_visible(False)
ax.spines["bottom"].set_color(COLORS[4])

plt.tight_layout()
plt.show()主题色渐变流图
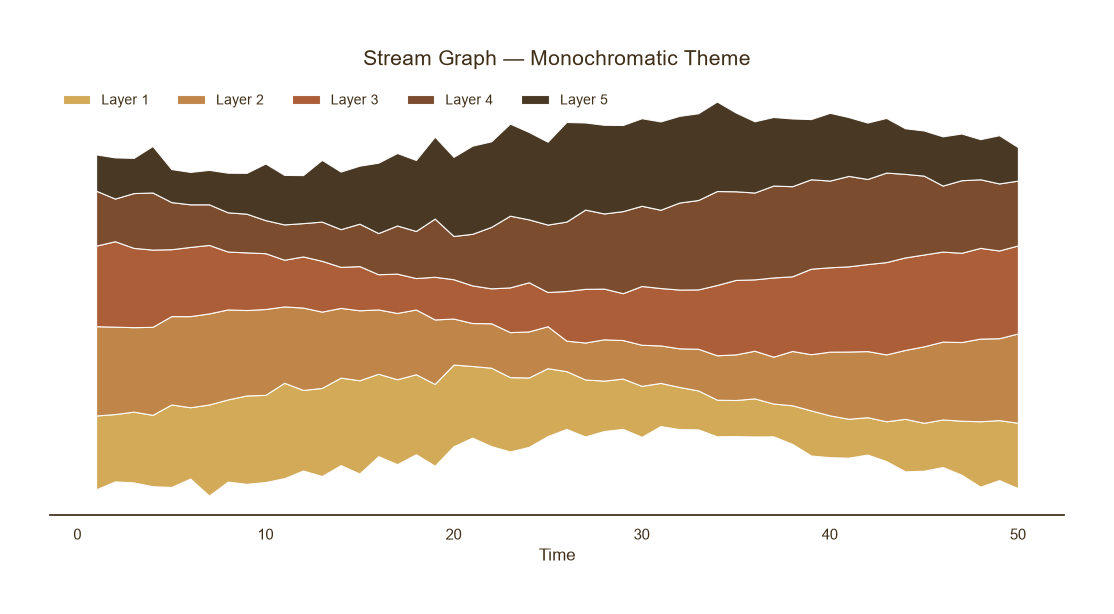
主题色渐变流图
Python46 行
import matplotlib.pyplot as plt
import numpy as np

BG = "#F7F3EC"

np.random.seed(1)
x = np.arange(1, 51)
n_series = 5
series = np.abs(np.array([
    22 + 9 * np.sin(x / 8 + i * 1.1) + np.random.normal(0, 1.5, len(x))
    for i in range(n_series)
]))

# 从金黄到深棕的单色渐变
from matplotlib.colors import LinearSegmentedColormap
cmap = LinearSegmentedColormap.from_list(
    "theme", ["#D0A64F", "#A8552E", "#3F2E18"], N=n_series
)
colors = [cmap(i / (n_series - 1)) for i in range(n_series)]

fig, ax = plt.subplots(figsize=(10.5, 5.5))

ax.stackplot(
    x, *series,
    baseline="wiggle",
    labels=[f"Layer {i+1}" for i in range(n_series)],
    colors=colors,
    alpha=0.95,
    edgecolor="white",
    linewidth=0.8,
)

ax.set_title("Stream Graph — Monochromatic Theme",
             fontsize=15, color="#3F2E18", pad=12)
ax.set_xlabel("Time", fontsize=12, color="#3F2E18")
ax.tick_params(axis="x", colors="#3F2E18")
ax.set_yticks([])
ax.legend(frameon=False, fontsize=10, labelcolor="#3F2E18",
          loc="upper left", ncol=5)

for s in ("top", "right", "left"):
    ax.spines[s].set_visible(False)
ax.spines["bottom"].set_color("#3F2E18")

plt.tight_layout()
plt.show()带时间轴标注的流图
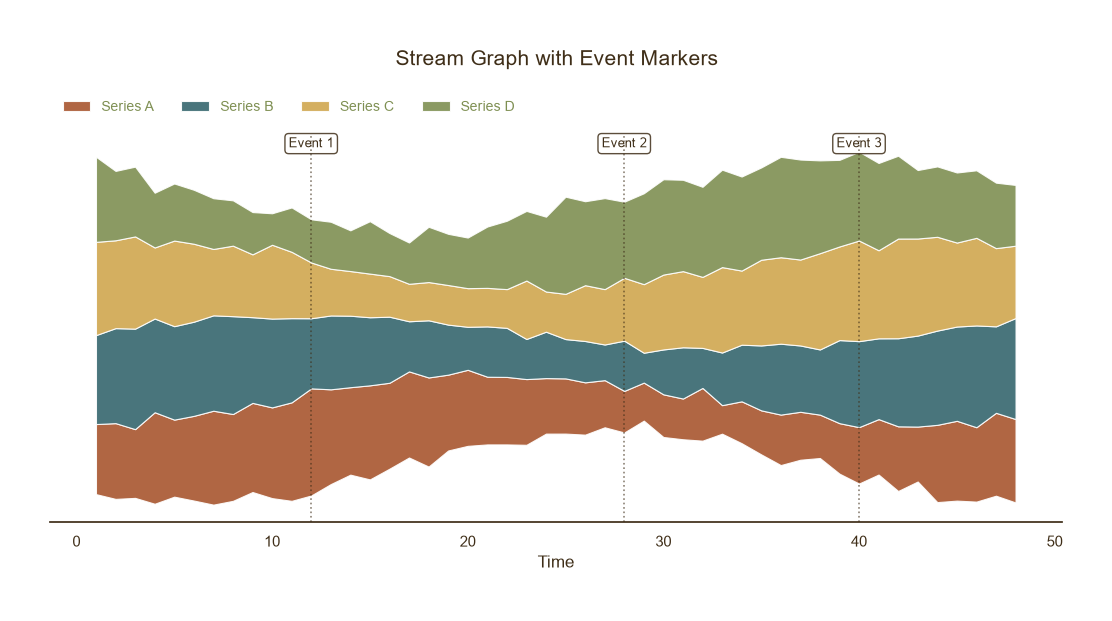
带时间轴标注的流图
Python55 行
import matplotlib.pyplot as plt
import numpy as np

COLORS = ["#A8552E", "#35666E", "#D0A64F", "#7E8F52", "#3F2E18"]
BG = "#F7F3EC"

np.random.seed(2)
x = np.arange(1, 49)
series = np.abs(np.array([
    20 + 8 * np.sin(x / 7 + i) + np.random.normal(0, 1.5, len(x))
    for i in range(4)
]))

fig, ax = plt.subplots(figsize=(10.5, 5.5))

ax.stackplot(
    x, *series,
    baseline="wiggle",
    labels=[f"Series {chr(65+i)}" for i in range(len(series))],
    colors=COLORS[:len(series)],
    alpha=0.9,
    edgecolor="white",
    linewidth=0.8,
)

# 关键事件竖线
events = {12: "Event 1", 28: "Event 2", 40: "Event 3"}
for xv, label in events.items():
    ax.axvline(xv, color=COLORS[4], linestyle=":",
               linewidth=1.2, alpha=0.6, zorder=5)
    ax.text(xv, ax.get_ylim()[1] * 0.92, label,
            ha="center", va="bottom", fontsize=9,
            color=COLORS[4],
            bbox=dict(boxstyle="round,pad=0.3",
                      facecolor="white",
                      edgecolor=COLORS[4], alpha=0.85))

fig.suptitle("Stream Graph with Event Markers",
             fontsize=15, color=COLORS[4], y=0.98)
ax.set_xlabel("Time", fontsize=12, color=COLORS[4])
ax.tick_params(axis="x", colors=COLORS[4])
ax.set_yticks([])
ax.legend(
    frameon=False, fontsize=10, labelcolor=COLORS[3],
    loc="lower left",
    bbox_to_anchor=(0, 1.02),
    ncol=4,
)

for s in ("top", "right", "left"):
    ax.spines[s].set_visible(False)
ax.spines["bottom"].set_color(COLORS[4])

plt.tight_layout()
plt.show()