RIDGELINE
绘图 · 第 14 / 36 章
基础山脊图(手写 KDE)
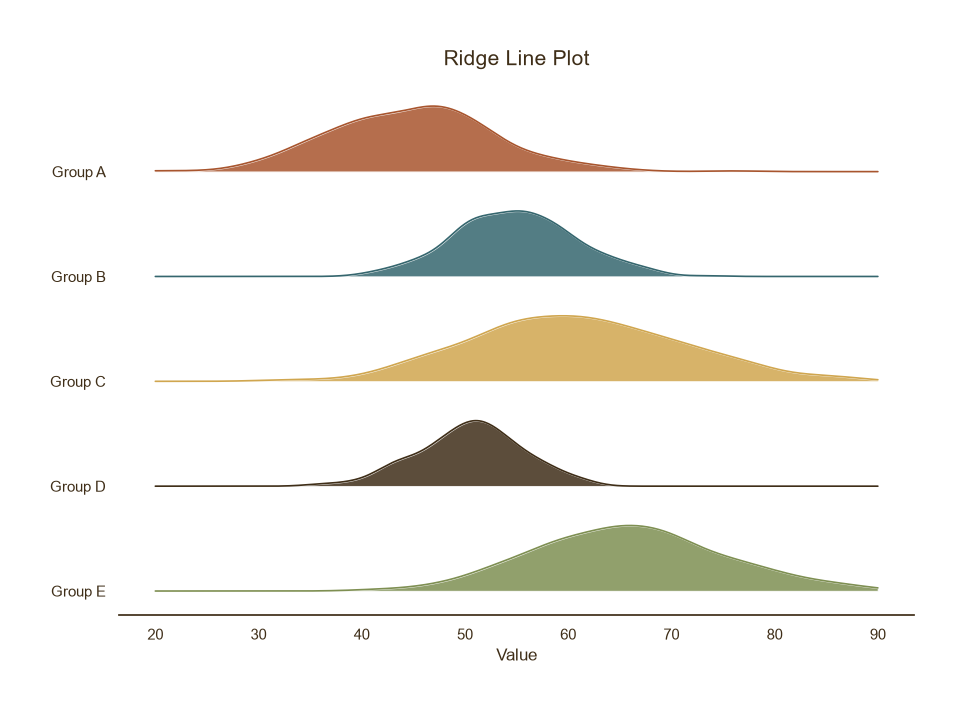
基础山脊图(手写 KDE)
Python49 行
import matplotlib.pyplot as plt
import numpy as np
from scipy.stats import gaussian_kde

COLORS = ["#A8552E", "#35666E", "#D0A64F", "#3F2E18", "#7E8F52"]
BG = "#F7F3EC"

np.random.seed(42)
groups = {
    "Group A": np.random.normal(45, 8, 300),
    "Group B": np.random.normal(55, 6, 300),
    "Group C": np.random.normal(60, 10, 300),
    "Group D": np.random.normal(50, 5, 300),
    "Group E": np.random.normal(65, 9, 300),
}

fig, ax = plt.subplots(figsize=(9, 6.5))

xs = np.linspace(20, 90, 400)
OVERLAP = 1.6   # 相邻山脊的重叠程度,>1 表示重叠

for i, ((name, vals), c) in enumerate(zip(groups.items(), COLORS)):
    y_base = -i * OVERLAP                      # 基线向下错位
    kde = gaussian_kde(vals)
    dens = kde(xs)
    dens = dens / dens.max()                   # 归一化到统一高度

    ax.fill_between(xs, y_base, y_base + dens,
                    color=c, alpha=0.85,
                    edgecolor="white", linewidth=1.0,
                    zorder=len(groups) - i)
    ax.plot(xs, y_base + dens, color=c,
            linewidth=1.2, zorder=len(groups) - i)

# y 轴用组名标注
ax.set_yticks([-i * OVERLAP for i in range(len(groups))])
ax.set_yticklabels(list(groups.keys()))

ax.set_title("Ridge Line Plot", fontsize=15, color=COLORS[3], pad=12)
ax.set_xlabel("Value", fontsize=12, color=COLORS[3])
ax.tick_params(axis="both", colors=COLORS[3])

# 去掉边框,只留底部
for s in ("top", "right", "left"):
    ax.spines[s].set_visible(False)
ax.spines["bottom"].set_color(COLORS[3])

plt.tight_layout()
plt.show()单色渐变山脊
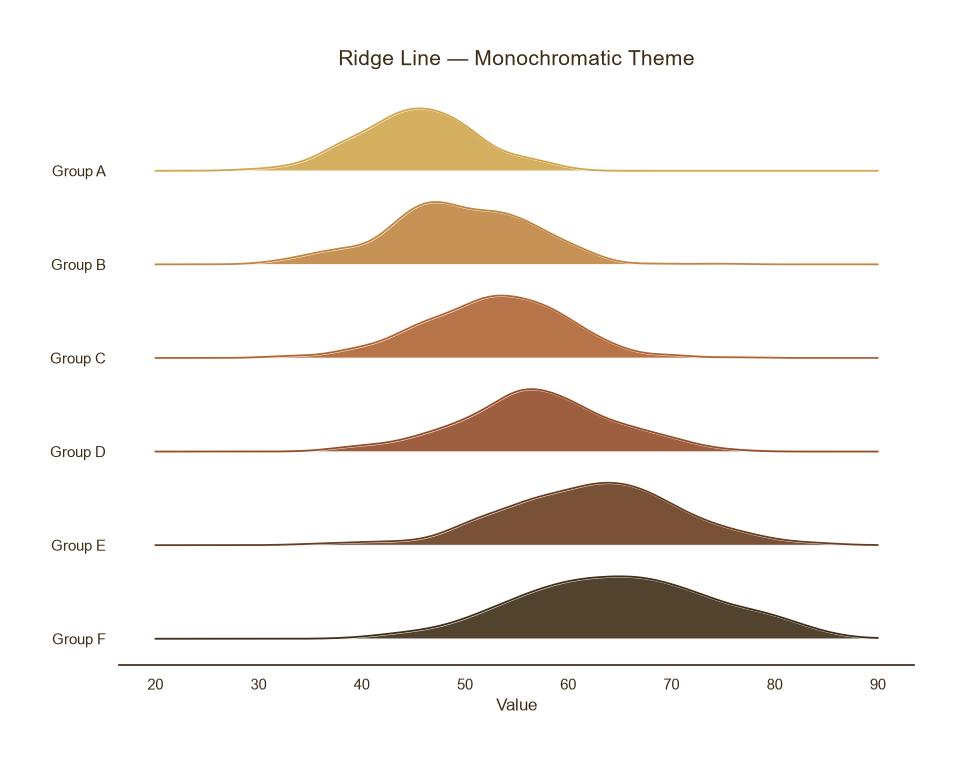
单色渐变山脊
Python52 行
import matplotlib.pyplot as plt
import numpy as np
from scipy.stats import gaussian_kde
from matplotlib.colors import LinearSegmentedColormap

BG = "#F7F3EC"

np.random.seed(1)
n_groups = 6
groups = {
    f"Group {chr(65+i)}": np.random.normal(45 + i * 4, 6 + i * 0.5, 300)
    for i in range(n_groups)
}

# 从金黄到深棕的渐变
cmap = LinearSegmentedColormap.from_list(
    "theme", ["#D0A64F", "#A8552E", "#3F2E18"], N=n_groups
)
colors = [cmap(i / (n_groups - 1)) for i in range(n_groups)]

fig, ax = plt.subplots(figsize=(9, 7))

xs = np.linspace(20, 90, 400)
OVERLAP = 1.5

for i, ((name, vals), c) in enumerate(zip(groups.items(), colors)):
    y_base = -i * OVERLAP
    kde = gaussian_kde(vals)
    dens = kde(xs)
    dens = dens / dens.max()

    ax.fill_between(xs, y_base, y_base + dens,
                    color=c, alpha=0.9,
                    edgecolor="white", linewidth=1.2,
                    zorder=n_groups - i)
    ax.plot(xs, y_base + dens, color=c,
            linewidth=1.3, zorder=n_groups - i)

ax.set_yticks([-i * OVERLAP for i in range(n_groups)])
ax.set_yticklabels(list(groups.keys()))

ax.set_title("Ridge Line — Monochromatic Theme",
             fontsize=15, color="#3F2E18", pad=12)
ax.set_xlabel("Value", fontsize=12, color="#3F2E18")
ax.tick_params(axis="both", colors="#3F2E18")

for s in ("top", "right", "left"):
    ax.spines[s].set_visible(False)
ax.spines["bottom"].set_color("#3F2E18")

plt.tight_layout()
plt.show()