DENDROGRAM
绘图 · 第 18 / 36 章
基础树状图
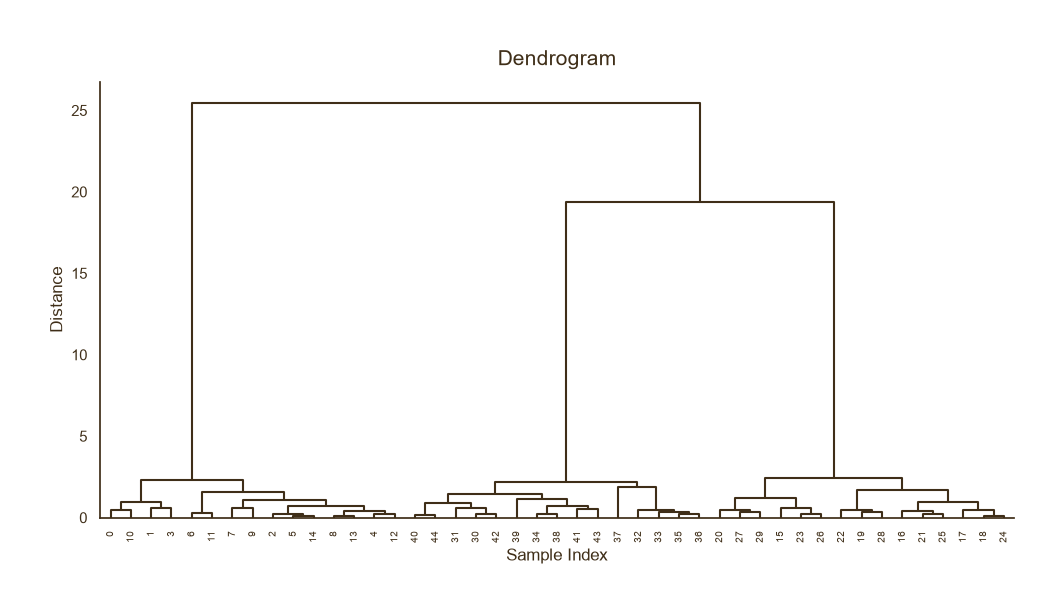
基础树状图
Python41 行
import matplotlib.pyplot as plt
import numpy as np
from scipy.cluster.hierarchy import dendrogram, linkage

COLORS = ["#A8552E", "#35666E", "#D0A64F", "#7E8F52", "#3F2E18"]
BG = "#F7F3EC"

np.random.seed(42)
# 三组明显分离的二维数据
X = np.vstack([
    np.random.normal([0, 0], 0.5, (15, 2)),
    np.random.normal([5, 5], 0.5, (15, 2)),
    np.random.normal([0, 5], 0.5, (15, 2)),
])

# 层次聚类
Z = linkage(X, method="ward")

fig, ax = plt.subplots(figsize=(10, 5.5))

dendrogram(
    Z,
    ax=ax,
    leaf_rotation=90,
    leaf_font_size=7,
    color_threshold=0,           # 0 = 全部用统一颜色
    above_threshold_color="#3F2E18",
)

ax.set_title("Dendrogram", fontsize=15, color="#3F2E18", pad=12)
ax.set_xlabel("Sample Index", fontsize=12, color="#3F2E18")
ax.set_ylabel("Distance", fontsize=12, color="#3F2E18")
ax.tick_params(axis="both", colors="#3F2E18")

for s in ("top", "right"):
    ax.spines[s].set_visible(False)
ax.spines["left"].set_color("#3F2E18")
ax.spines["bottom"].set_color("#3F2E18")

plt.tight_layout()
plt.show()按簇着色
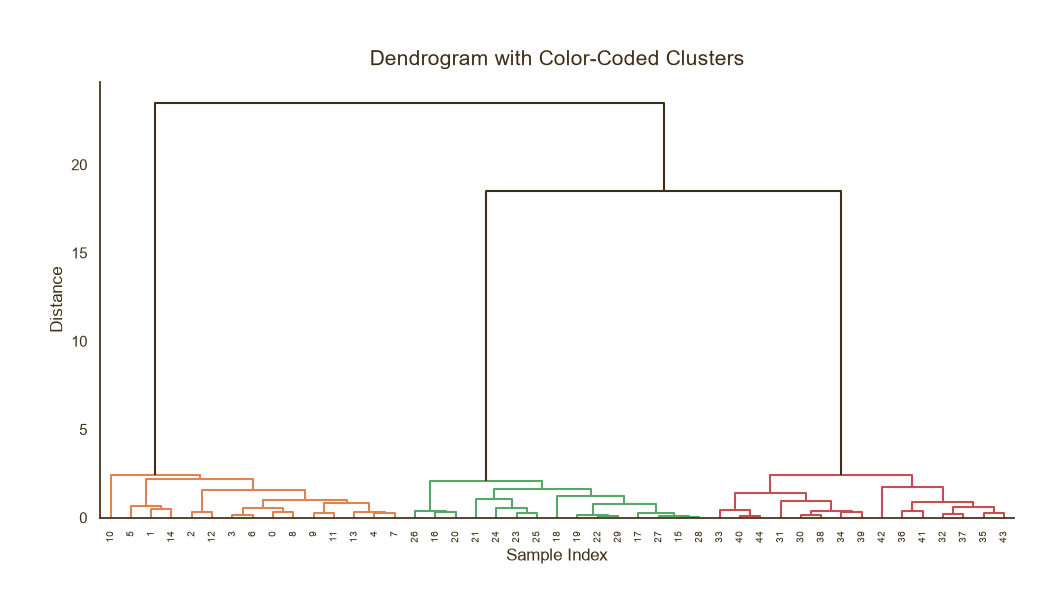
按簇着色
Python40 行
import matplotlib.pyplot as plt
import numpy as np
from scipy.cluster.hierarchy import dendrogram, linkage

COLORS = ["#A8552E", "#35666E", "#D0A64F", "#7E8F52", "#3F2E18"]
BG = "#F7F3EC"

np.random.seed(0)
X = np.vstack([
    np.random.normal([0, 0], 0.5, (15, 2)),
    np.random.normal([5, 5], 0.5, (15, 2)),
    np.random.normal([0, 5], 0.5, (15, 2)),
])
Z = linkage(X, method="ward")

fig, ax = plt.subplots(figsize=(10, 5.5))

dendrogram(
    Z,
    ax=ax,
    leaf_rotation=90,
    leaf_font_size=7,
    color_threshold=3.0,                      # 切分阈值:低于此距离的枝用不同色
    above_threshold_color="#3F2E18",          # 高于阈值的枝统一深棕
    link_color_func=None,
)

ax.set_title("Dendrogram with Color-Coded Clusters",
             fontsize=15, color="#3F2E18", pad=12)
ax.set_xlabel("Sample Index", fontsize=12, color="#3F2E18")
ax.set_ylabel("Distance", fontsize=12, color="#3F2E18")
ax.tick_params(axis="both", colors="#3F2E18")

for s in ("top", "right"):
    ax.spines[s].set_visible(False)
ax.spines["left"].set_color("#3F2E18")
ax.spines["bottom"].set_color("#3F2E18")

plt.tight_layout()
plt.show()自定义簇颜色为主题色
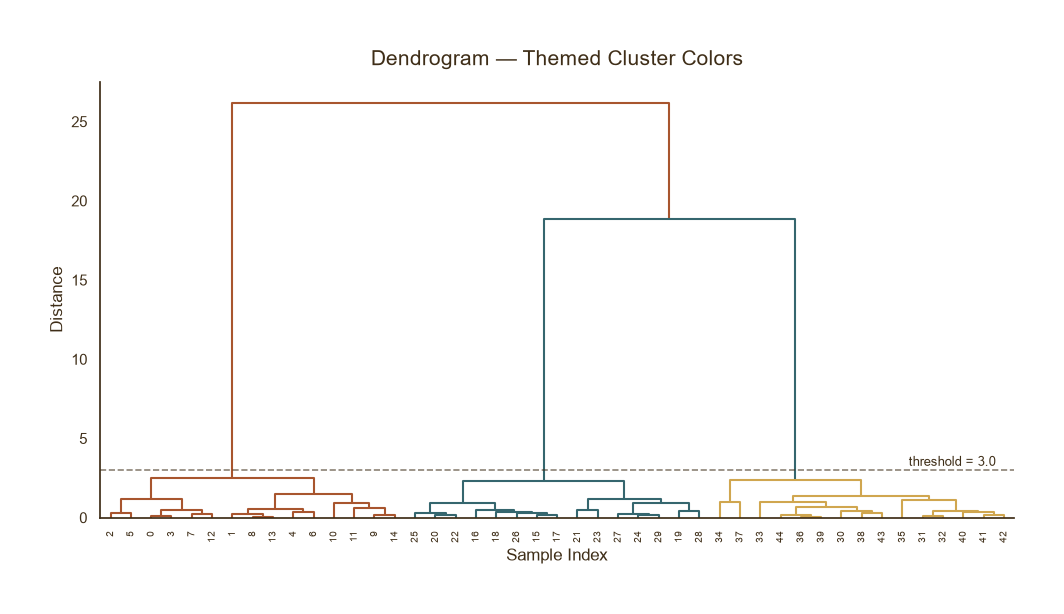
自定义簇颜色为主题色
Python71 行
import matplotlib.pyplot as plt
import numpy as np
from scipy.cluster.hierarchy import dendrogram, linkage, fcluster
from scipy.spatial.distance import pdist

COLORS = ["#A8552E", "#35666E", "#D0A64F", "#7E8F52", "#3F2E18"]
BG = "#F7F3EC"

np.random.seed(1)
X = np.vstack([
    np.random.normal([0, 0], 0.5, (15, 2)),
    np.random.normal([5, 5], 0.5, (15, 2)),
    np.random.normal([0, 5], 0.5, (15, 2)),
])
Z = linkage(X, method="ward")

# 先确定簇标签
threshold = 3.0
cluster_labels = fcluster(Z, t=threshold, criterion="distance")
n_clusters = cluster_labels.max()

# 把主题色转成十六进制(SciPy 要求 #RRGGBB)
theme_hex = [c.lstrip("#") for c in COLORS]

# 建立 cluster id → 颜色的映射
cluster_color = {i + 1: f"#{theme_hex[i % len(theme_hex)]}"
                 for i in range(n_clusters)}

# 为每个 link 决定颜色:取该 link 合并后的簇标签
n_samples = X.shape[0]
link_cluster = {}
for i, (a, b) in enumerate(Z[0:, :2].astype(int)):
    link_id = n_samples + i
    # 该 link 的簇标签:优先取非单点一侧
    ca = link_cluster.get(a, cluster_labels[a] if a < n_samples else 0)
    cb = link_cluster.get(b, cluster_labels[b] if b < n_samples else 0)
    chosen = ca if ca != 0 else cb
    link_cluster[link_id] = chosen

def link_color_func(link_id):
    cl = link_cluster.get(link_id, 0)
    return cluster_color.get(cl, "#3F2E18")

fig, ax = plt.subplots(figsize=(10, 5.5))

dendrogram(
    Z, ax=ax,
    leaf_rotation=90, leaf_font_size=7,
    link_color_func=link_color_func,
)

ax.set_title("Dendrogram — Themed Cluster Colors",
             fontsize=15, color="#3F2E18", pad=12)
ax.set_xlabel("Sample Index", fontsize=12, color="#3F2E18")
ax.set_ylabel("Distance", fontsize=12, color="#3F2E18")
ax.tick_params(axis="both", colors="#3F2E18")

for s in ("top", "right"):
    ax.spines[s].set_visible(False)
ax.spines["left"].set_color("#3F2E18")
ax.spines["bottom"].set_color("#3F2E18")

# 阈值线
ax.axhline(threshold, color="#3F2E18", linestyle="--",
           linewidth=1.2, alpha=0.6)
ax.text(ax.get_xlim()[1] * 0.98, threshold + 0.1,
        f"threshold = {threshold}",
        ha="right", va="bottom", fontsize=9, color="#3F2E18")

plt.tight_layout()
plt.show()带热力图的组合图
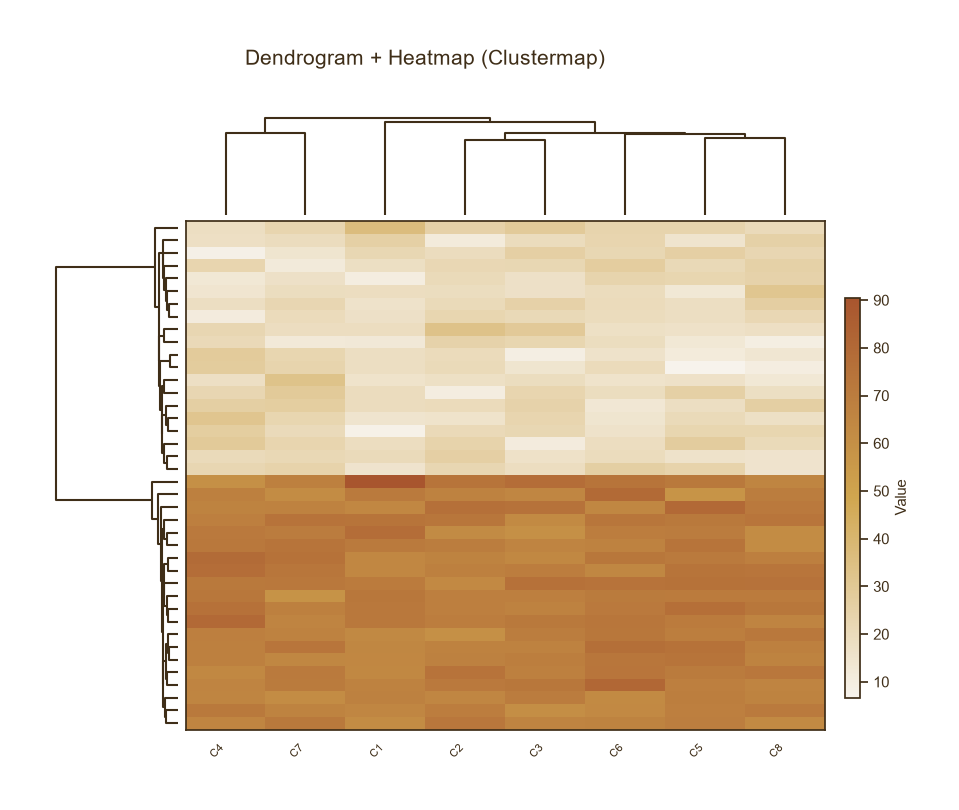
带热力图的组合图
Python73 行
import matplotlib.pyplot as plt
import numpy as np
from scipy.cluster.hierarchy import dendrogram, linkage, leaves_list
from scipy.spatial.distance import pdist
from matplotlib.colors import LinearSegmentedColormap
from matplotlib.gridspec import GridSpec

BG = "#F7F3EC"
CMAP = LinearSegmentedColormap.from_list(
    "theme", ["#F7F3EC", "#D0A64F", "#A8552E"], N=256
)

np.random.seed(2)
# 构造两个簇
cluster1 = np.random.normal(20, 5, (20, 8))
cluster2 = np.random.normal(70, 5, (20, 8))
data = np.vstack([cluster1, cluster2])

# 行聚类
row_dist = pdist(data, metric="euclidean")
row_linkage = linkage(row_dist, method="average")
row_order = leaves_list(row_linkage)

# 列聚类
col_dist = pdist(data.T, metric="euclidean")
col_linkage = linkage(col_dist, method="average")
col_order = leaves_list(col_linkage)

data_ord = data[np.ix_(row_order, col_order)]

# 布局:行树状图在左,热力图在右,列树状图在上
fig = plt.figure(figsize=(10, 8))
gs = GridSpec(2, 2, figure=fig,
              width_ratios=[0.8, 4],
              height_ratios=[0.8, 4],
              hspace=0.02, wspace=0.02)

# 行树状图
ax_row = fig.add_subplot(gs[1, 0])
dendrogram(row_linkage, orientation="left", ax=ax_row,
           no_labels=True, color_threshold=0,
           above_threshold_color="#3F2E18")
ax_row.invert_yaxis()
ax_row.axis("off")

# 列树状图
ax_col = fig.add_subplot(gs[0, 1])
ax_col.set_facecolor(BG)
dendrogram(col_linkage, orientation="top", ax=ax_col,
           no_labels=True, color_threshold=0,
           above_threshold_color="#3F2E18")
ax_col.axis("off")

# 热力图
ax_heat = fig.add_subplot(gs[1, 1])
ax_heat.set_facecolor(BG)
im = ax_heat.imshow(data_ord, cmap=CMAP, aspect="auto")
ax_heat.set_xticks(range(data.shape[1]))
ax_heat.set_yticks([])
ax_heat.set_xticklabels([f"C{i+1}" for i in col_order],
                        rotation=45, ha="right", fontsize=8)
ax_heat.tick_params(colors="#3F2E18")

cbar_ax = fig.add_axes([0.92, 0.15, 0.015, 0.5])
cbar = fig.colorbar(im, cax=cbar_ax)
cbar.set_label("Value", fontsize=11, color="#3F2E18")
cbar.ax.tick_params(colors="#3F2E18")
cbar.outline.set_edgecolor("#3F2E18")

fig.suptitle("Dendrogram + Heatmap (Clustermap)",
             fontsize=15, color="#3F2E18", y=0.96)

plt.show()环形树状图
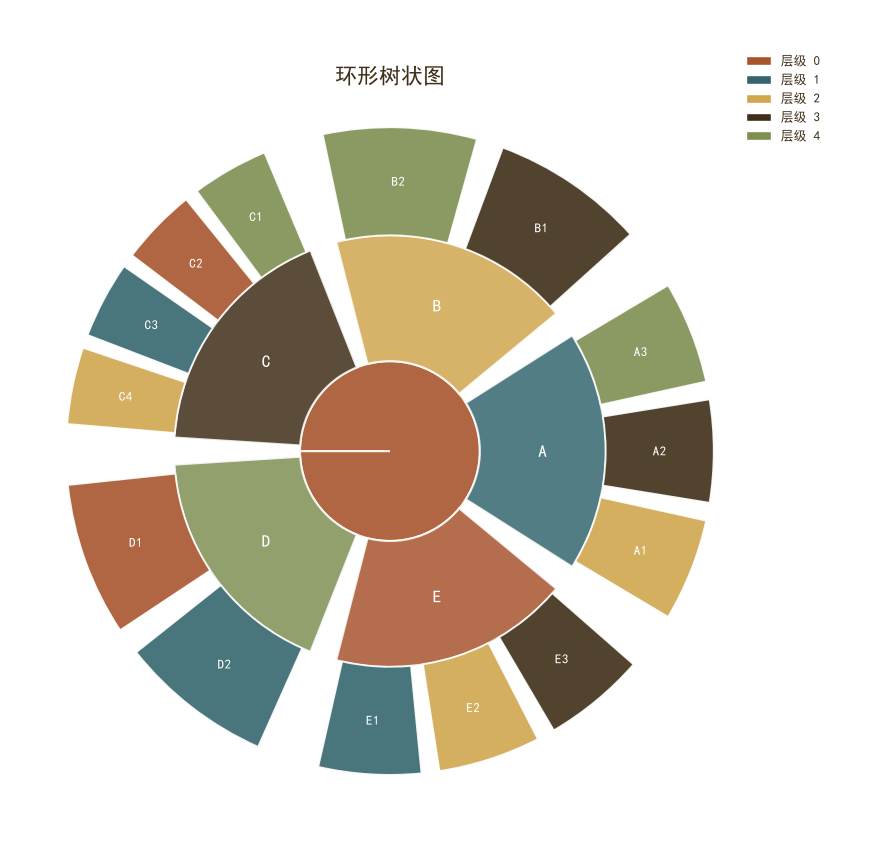
环形树状图
Python84 行
import matplotlib.pyplot as plt
import numpy as np

# 设置中文字体(如需显示中文标签)
plt.rcParams['font.sans-serif'] = ['SimHei', 'Arial Unicode MS', 'DejaVu Sans']
plt.rcParams['axes.unicode_minus'] = False

# 主题色
colors = ['#A8552E', '#35666E', '#D0A64F', '#3F2E18', '#7E8F52']

# 定义层级数据:根 -> 一级分支 -> 二级分支
# 结构:{一级节点: [二级节点列表]}
data = {
    'A': ['A1', 'A2', 'A3'],
    'B': ['B1', 'B2'],
    'C': ['C1', 'C2', 'C3', 'C4'],
    'D': ['D1', 'D2'],
    'E': ['E1', 'E2', 'E3']
}

# 计算每个一级节点的角度范围(等分)
n = len(data)
angles = np.linspace(0, 2 * np.pi, n, endpoint=False)
width = 2 * np.pi / n  # 每个扇区的宽度

# 创建极坐标图
fig, ax = plt.subplots(figsize=(8, 8), subplot_kw={'projection': 'polar'})

# 绘制根节点(中心圆)
ax.bar(0, 0.5, width=2*np.pi, bottom=0, color=colors[0], alpha=0.9, edgecolor='white', linewidth=1.5)

# 绘制一级和二级分支
for i, (parent, children) in enumerate(data.items()):
    # 一级分支的角度中心
    theta_center = angles[i]
    # 一级分支占据的角度范围
    theta_start = theta_center - width * 0.45
    theta_end = theta_center + width * 0.45

    # 一级分支的颜色(从主题色中循环选取,跳过根色)
    color_parent = colors[(i + 1) % len(colors)]

    # 绘制一级分支的扇形(从半径0.5到1.2)
    ax.bar(theta_center, 0.7, width=width * 0.9, bottom=0.5,
           color=color_parent, alpha=0.85, edgecolor='white', linewidth=1.5)

    # 添加一级分支标签
    ax.text(theta_center, 0.85, parent, ha='center', va='center',
            fontsize=12, fontweight='bold', color='white')

    # 绘制二级分支
    m = len(children)
    if m > 0:
        # 二级分支的角度宽度
        sub_width = (theta_end - theta_start) / m
        for j, child in enumerate(children):
            sub_theta = theta_start + sub_width * (j + 0.5)
            # 二级分支颜色:基于一级分支颜色变亮/变暗,或使用其他主题色
            color_child = colors[(i + 2 + j) % len(colors)]

            # 绘制二级分支的扇形(从半径1.2到1.8)
            ax.bar(sub_theta, 0.6, width=sub_width * 0.85, bottom=1.2,
                   color=color_child, alpha=0.9, edgecolor='white', linewidth=1.2)

            # 添加二级分支标签
            ax.text(sub_theta, 1.5, child, ha='center', va='center',
                    fontsize=9, color='white', fontweight='bold')

# 移除极坐标的刻度和标签
ax.set_xticks([])
ax.set_yticks([])
ax.spines['polar'].set_visible(False)

# 设置标题
ax.set_title('环形树状图', fontsize=16, fontweight='bold', pad=20, color='#3F2E18')

# 添加图例(可选)
legend_elements = [plt.Rectangle((0,0),1,1, facecolor=colors[i], edgecolor='white', label=f'层级 {i}')
                   for i in range(len(colors))]
ax.legend(handles=legend_elements, loc='upper right', bbox_to_anchor=(1.15, 1.1),
          frameon=False, fontsize=9)

plt.tight_layout()
plt.show()