LOLLIPOP
绘图 · 第 20 / 36 章
基础棒棒糖图(垂直)
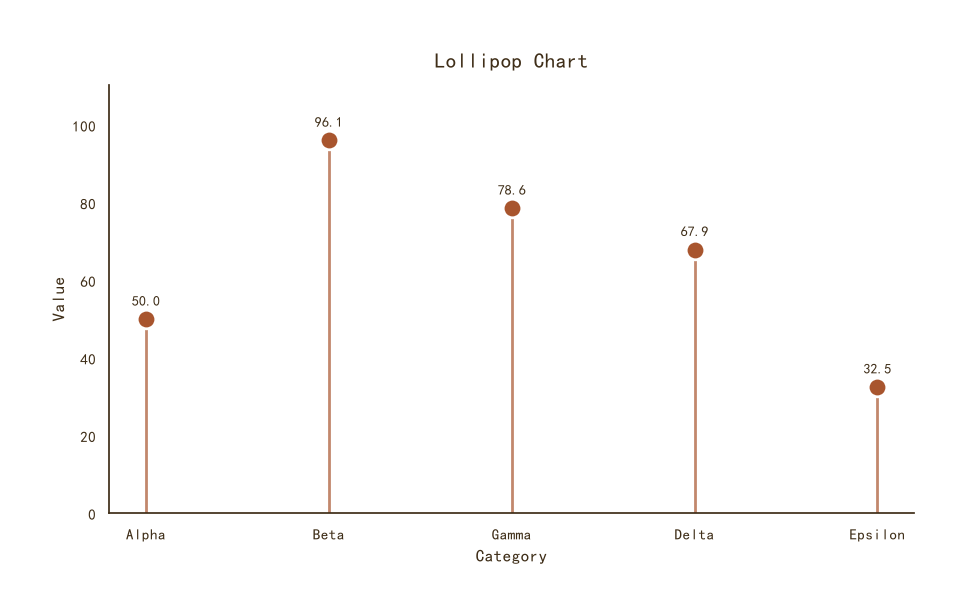
基础棒棒糖图(垂直)
Python44 行
import matplotlib.pyplot as plt
import numpy as np

COLORS = ["#A8552E", "#35666E", "#D0A64F", "#3F2E18", "#7E8F52"]
BG = "#F7F3EC"

np.random.seed(42)
categories = ["Alpha", "Beta", "Gamma", "Delta", "Epsilon"]
values = np.random.uniform(20, 100, len(categories))

fig, ax = plt.subplots(figsize=(9, 5.5))

x = np.arange(len(categories))

# 细线(从 0 到数值)
ax.vlines(x, 0, values, color=COLORS[0],
          linewidth=2.0, alpha=0.7, zorder=2)

# 圆点(在顶端)
ax.scatter(x, values, s=180, color=COLORS[0],
           edgecolor="white", linewidth=2.0, zorder=3)

# 数值标注
for xi, v in zip(x, values):
    ax.text(xi, v + 3, f"{v:.1f}",
            ha="center", va="bottom",
            fontsize=10, color=COLORS[3])

ax.set_xticks(x)
ax.set_xticklabels(categories)
ax.set_ylim(0, values.max() * 1.15)

ax.set_title("Lollipop Chart", fontsize=15, color=COLORS[3], pad=12)
ax.set_xlabel("Category", fontsize=12, color=COLORS[3])
ax.set_ylabel("Value", fontsize=12, color=COLORS[3])
ax.tick_params(axis="both", colors=COLORS[3])

for s in ("top", "right"):
    ax.spines[s].set_visible(False)
ax.spines["left"].set_color(COLORS[3])
ax.spines["bottom"].set_color(COLORS[3])

plt.tight_layout()
plt.show()水平棒棒糖 + 排序
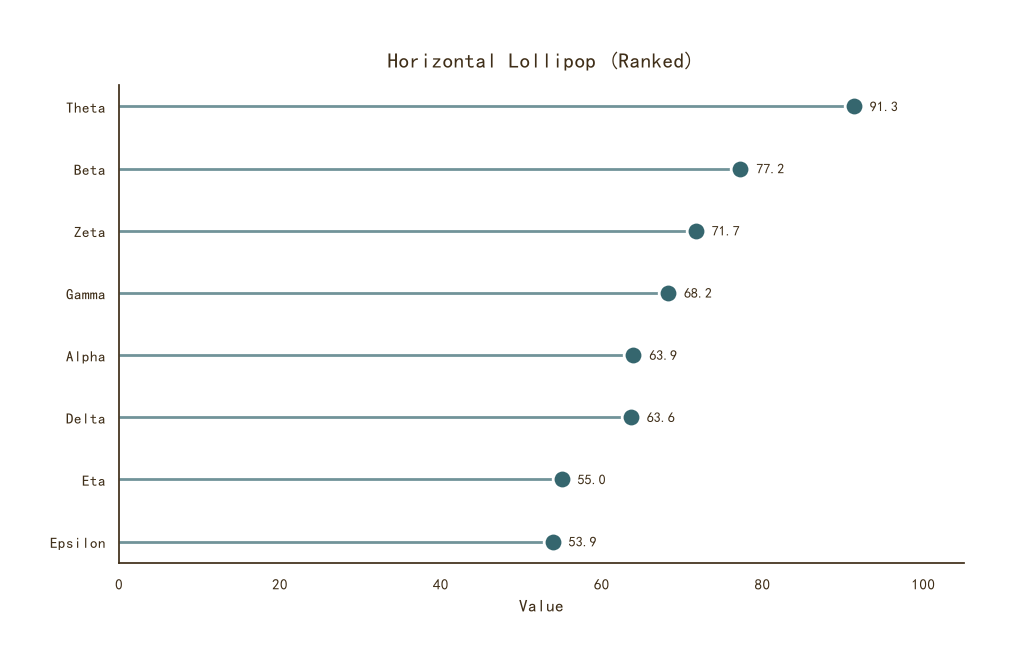
水平棒棒糖 + 排序
Python50 行
import matplotlib.pyplot as plt
import numpy as np

COLORS = ["#A8552E", "#35666E", "#D0A64F", "#3F2E18", "#7E8F52"]
BG = "#F7F3EC"

np.random.seed(0)
categories = ["Alpha", "Beta", "Gamma", "Delta",
              "Epsilon", "Zeta", "Eta", "Theta"]
values = np.random.uniform(20, 100, len(categories))

# 降序排序
order = np.argsort(values)
cats_sorted = [categories[i] for i in order]
vals_sorted = values[order]

y = np.arange(len(cats_sorted))

fig, ax = plt.subplots(figsize=(9.5, 6))

# 细线
ax.hlines(y, 0, vals_sorted, color=COLORS[1],
          linewidth=2.0, alpha=0.7, zorder=2)

# 圆点
ax.scatter(vals_sorted, y, s=180, color=COLORS[1],
           edgecolor="white", linewidth=2.0, zorder=3)

# 数值标注在圆点右侧
for yi, v in zip(y, vals_sorted):
    ax.text(v + 2, yi, f"{v:.1f}",
            va="center", ha="left",
            fontsize=10, color=COLORS[3])

ax.set_yticks(y)
ax.set_yticklabels(cats_sorted)
ax.set_xlim(0, vals_sorted.max() * 1.15)

ax.set_title("Horizontal Lollipop (Ranked)",
             fontsize=15, color=COLORS[3], pad=12)
ax.set_xlabel("Value", fontsize=12, color=COLORS[3])
ax.tick_params(axis="both", colors=COLORS[3])

for s in ("top", "right"):
    ax.spines[s].set_visible(False)
ax.spines["left"].set_color(COLORS[3])
ax.spines["bottom"].set_color(COLORS[3])

plt.tight_layout()
plt.show()按值渐变着色
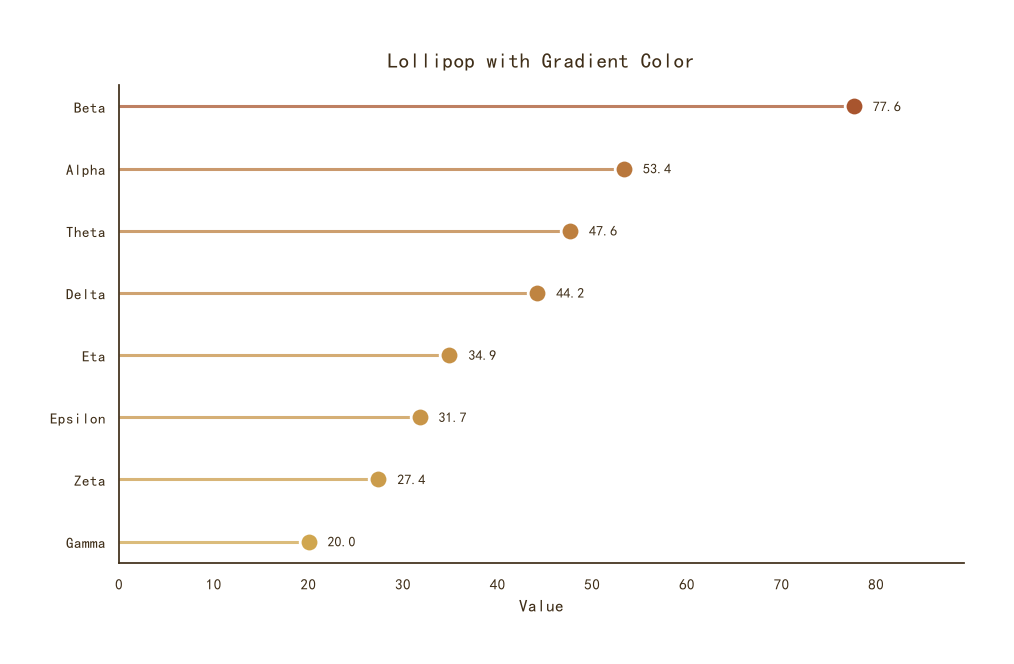
按值渐变着色
Python50 行
import matplotlib.pyplot as plt
import numpy as np
from matplotlib.colors import LinearSegmentedColormap

BG = "#F7F3EC"
CMAP = LinearSegmentedColormap.from_list(
    "theme", ["#D0A64F", "#A8552E"], N=256
)

np.random.seed(1)
categories = ["Alpha", "Beta", "Gamma", "Delta",
              "Epsilon", "Zeta", "Eta", "Theta"]
values = np.random.uniform(20, 100, len(categories))

order = np.argsort(values)[::-1]
cats_sorted = [categories[i] for i in order]
vals_sorted = values[order]

# 颜色映射
norm = (vals_sorted - vals_sorted.min()) / (vals_sorted.max() - vals_sorted.min())
colors = [CMAP(v) for v in norm]

y = np.arange(len(cats_sorted))

fig, ax = plt.subplots(figsize=(9.5, 6))

for yi, v, c in zip(y, vals_sorted, colors):
    ax.hlines(yi, 0, v, color=c, linewidth=2.2, alpha=0.75, zorder=2)
    ax.scatter(v, yi, s=180, color=c,
               edgecolor="white", linewidth=2.0, zorder=3)
    ax.text(v + 2, yi, f"{v:.1f}",
            va="center", ha="left", fontsize=10, color="#3F2E18")

ax.set_yticks(y)
ax.set_yticklabels(cats_sorted)
ax.set_xlim(0, vals_sorted.max() * 1.15)
ax.invert_yaxis()

ax.set_title("Lollipop with Gradient Color",
             fontsize=15, color="#3F2E18", pad=12)
ax.set_xlabel("Value", fontsize=12, color="#3F2E18")
ax.tick_params(axis="both", colors="#3F2E18")

for s in ("top", "right"):
    ax.spines[s].set_visible(False)
ax.spines["left"].set_color("#3F2E18")
ax.spines["bottom"].set_color("#3F2E18")

plt.tight_layout()
plt.show()发散棒棒糖(正负对比)
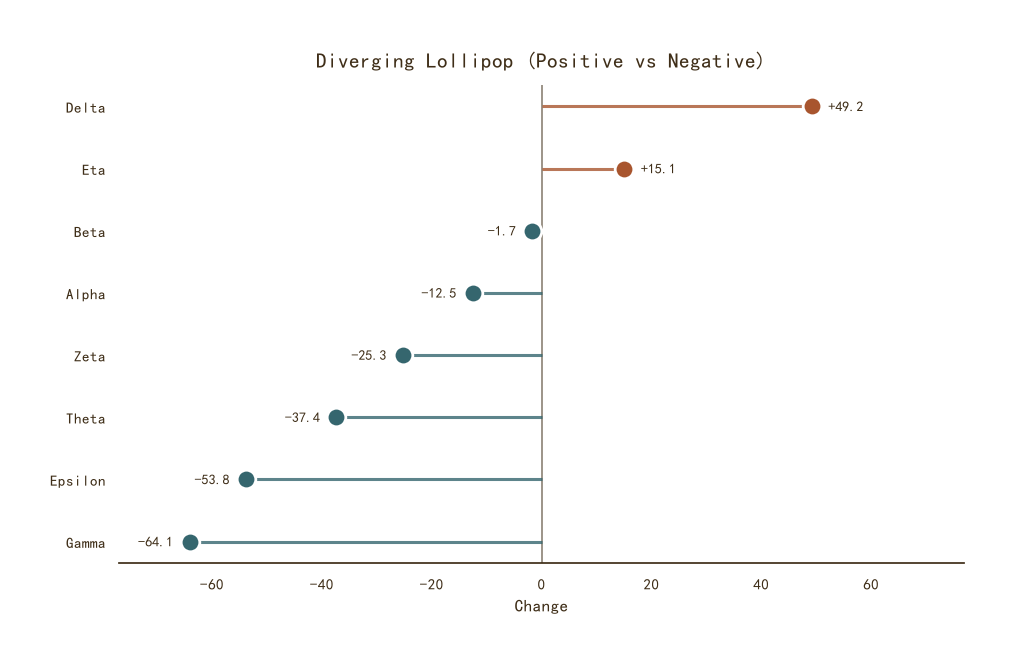
发散棒棒糖(正负对比)
Python54 行
import matplotlib.pyplot as plt
import numpy as np

COLORS = ["#A8552E", "#35666E", "#D0A64F", "#3F2E18", "#7E8F52"]
BG = "#F7F3EC"

np.random.seed(2)
categories = ["Alpha", "Beta", "Gamma", "Delta",
              "Epsilon", "Zeta", "Eta", "Theta"]
values = np.random.normal(0, 30, len(categories))

order = np.argsort(values)
cats_sorted = [categories[i] for i in order]
vals_sorted = values[order]

y = np.arange(len(cats_sorted))

fig, ax = plt.subplots(figsize=(9.5, 6))

# 按正负分配颜色
for yi, v in zip(y, vals_sorted):
    color = COLORS[0] if v >= 0 else COLORS[1]   # 棕橙正 / 深青负
    ax.hlines(yi, 0, v, color=color, linewidth=2.2, alpha=0.8, zorder=2)
    ax.scatter(v, yi, s=180, color=color,
               edgecolor="white", linewidth=2.0, zorder=3)

# 数值标注(正负分开方向)
for yi, v in zip(y, vals_sorted):
    offset = 3 if v >= 0 else -3
    ha = "left" if v >= 0 else "right"
    ax.text(v + offset, yi, f"{v:+.1f}",
            va="center", ha=ha, fontsize=10, color=COLORS[3])

# 0 基线
ax.axvline(0, color=COLORS[3], linewidth=1.2,
           linestyle="-", alpha=0.6, zorder=1)

ax.set_yticks(y)
ax.set_yticklabels(cats_sorted)

x_abs = max(abs(vals_sorted.min()), abs(vals_sorted.max())) * 1.2
ax.set_xlim(-x_abs, x_abs)

ax.set_title("Diverging Lollipop (Positive vs Negative)",
             fontsize=15, color=COLORS[3], pad=12)
ax.set_xlabel("Change", fontsize=12, color=COLORS[3])
ax.tick_params(axis="both", colors=COLORS[3])

for s in ("top", "right", "left"):
    ax.spines[s].set_visible(False)
ax.spines["bottom"].set_color(COLORS[3])

plt.tight_layout()
plt.show()分组棒棒糖(多序列对比)
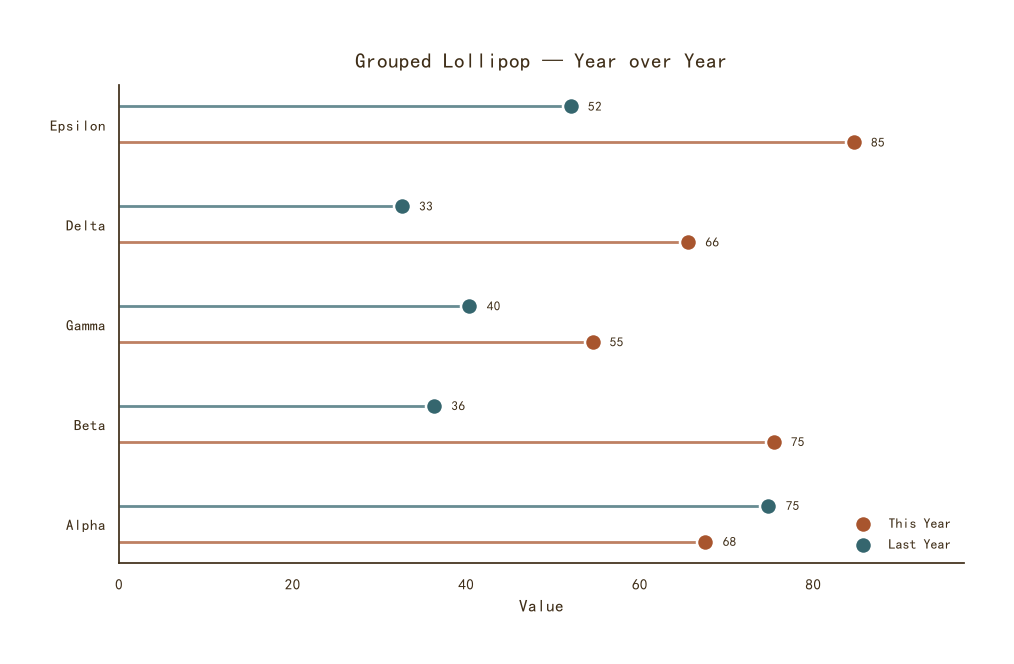
分组棒棒糖(多序列对比)
Python51 行
import matplotlib.pyplot as plt
import numpy as np

COLORS = ["#A8552E", "#35666E", "#D0A64F", "#3F2E18", "#7E8F52"]
BG = "#F7F3EC"

np.random.seed(3)
categories = ["Alpha", "Beta", "Gamma", "Delta", "Epsilon"]
series = {
    "This Year": np.random.uniform(40, 90, len(categories)),
    "Last Year": np.random.uniform(30, 80, len(categories)),
}

y = np.arange(len(categories))
offset = 0.18

fig, ax = plt.subplots(figsize=(9.5, 6))

for i, ((name, vals), c) in enumerate(zip(series.items(), COLORS)):
    y_pos = y + (i - 0.5) * offset * 2
    ax.hlines(y_pos, 0, vals, color=c,
              linewidth=2.0, alpha=0.75, zorder=2)
    ax.scatter(vals, y_pos, s=150, color=c,
               edgecolor="white", linewidth=1.8,
               zorder=3, label=name)

    # 数值标注
    for yi, v in zip(y_pos, vals):
        ax.text(v + 2, yi, f"{v:.0f}",
                va="center", ha="left",
                fontsize=9, color=COLORS[3])

ax.set_yticks(y)
ax.set_yticklabels(categories)
ax.set_xlim(0, max(series["This Year"].max(),
                   series["Last Year"].max()) * 1.15)

ax.set_title("Grouped Lollipop — Year over Year",
             fontsize=15, color=COLORS[3], pad=12)
ax.set_xlabel("Value", fontsize=12, color=COLORS[3])
ax.tick_params(axis="both", colors=COLORS[3])
ax.legend(frameon=False, fontsize=10, labelcolor=COLORS[3],
          loc="lower right")

for s in ("top", "right"):
    ax.spines[s].set_visible(False)
ax.spines["left"].set_color(COLORS[3])
ax.spines["bottom"].set_color(COLORS[3])

plt.tight_layout()
plt.show()带连接线的棒棒糖(变化对比)
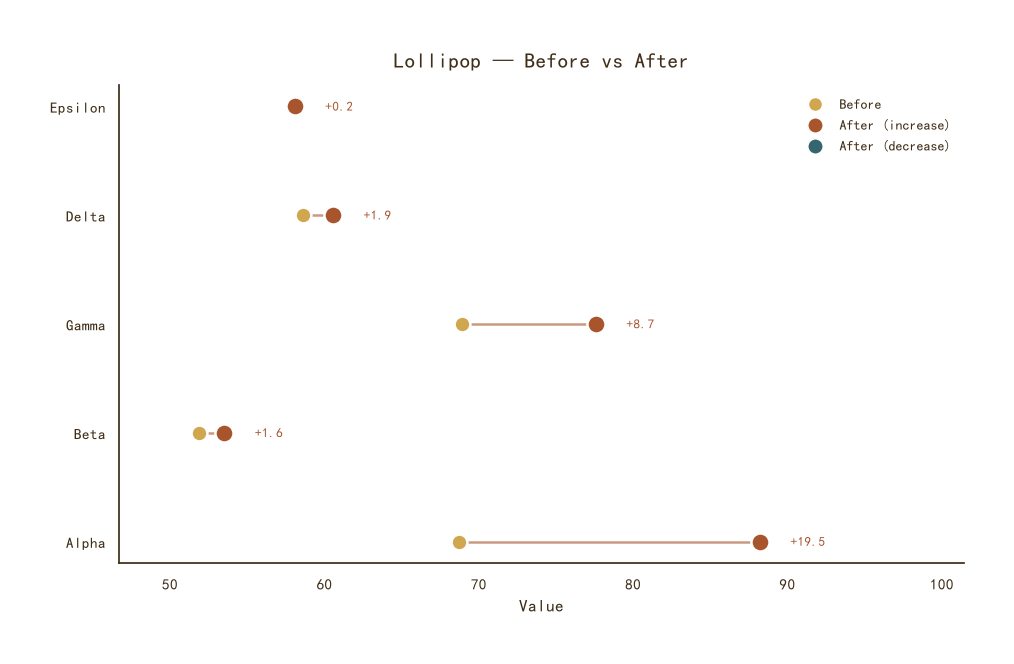
带连接线的棒棒糖(变化对比)
Python67 行
import matplotlib.pyplot as plt
import numpy as np

COLORS = ["#A8552E", "#35666E", "#D0A64F", "#3F2E18", "#7E8F52"]
BG = "#F7F3EC"

np.random.seed(4)
categories = ["Alpha", "Beta", "Gamma", "Delta", "Epsilon"]
before = np.random.uniform(30, 70, len(categories))
after  = before + np.random.normal(5, 10, len(categories))

y = np.arange(len(categories))

fig, ax = plt.subplots(figsize=(9.5, 6))

for yi, b, a in zip(y, before, after):
    # 变化连线
    change_color = COLORS[0] if a >= b else COLORS[1]
    ax.plot([b, a], [yi, yi], color=change_color,
            linewidth=1.8, alpha=0.6, zorder=2)
    # 起点(浅色)
    ax.scatter(b, yi, s=130, color=COLORS[2],
               edgecolor="white", linewidth=1.8, zorder=3)
    # 终点(深色,按增减变色)
    ax.scatter(a, yi, s=170, color=change_color,
               edgecolor="white", linewidth=1.8, zorder=4)
    # 变化量标注
    delta = a - b
    ax.text(max(a, b) + 2, yi, f"{delta:+.1f}",
            va="center", ha="left", fontsize=9,
            color=change_color, fontweight="bold")

ax.set_yticks(y)
ax.set_yticklabels(categories)

x_min = min(before.min(), after.min()) * 0.9
x_max = max(before.max(), after.max()) * 1.15
ax.set_xlim(x_min, x_max)

# 图例
from matplotlib.lines import Line2D
legend_handles = [
    Line2D([0], [0], marker="o", color="none",
           markerfacecolor=COLORS[2], markeredgecolor="white",
           markersize=10, label="Before"),
    Line2D([0], [0], marker="o", color="none",
           markerfacecolor=COLORS[0], markeredgecolor="white",
           markersize=11, label="After (increase)"),
    Line2D([0], [0], marker="o", color="none",
           markerfacecolor=COLORS[1], markeredgecolor="white",
           markersize=11, label="After (decrease)"),
]
ax.legend(handles=legend_handles, frameon=False, fontsize=10,
          labelcolor=COLORS[3], loc="upper right")

ax.set_title("Lollipop — Before vs After",
             fontsize=15, color=COLORS[3], pad=12)
ax.set_xlabel("Value", fontsize=12, color=COLORS[3])
ax.tick_params(axis="both", colors=COLORS[3])

for s in ("top", "right"):
    ax.spines[s].set_visible(False)
ax.spines["left"].set_color(COLORS[3])
ax.spines["bottom"].set_color(COLORS[3])

plt.tight_layout()
plt.show()