SUNBURST
绘图 · 第 28 / 36 章
基础旭日图
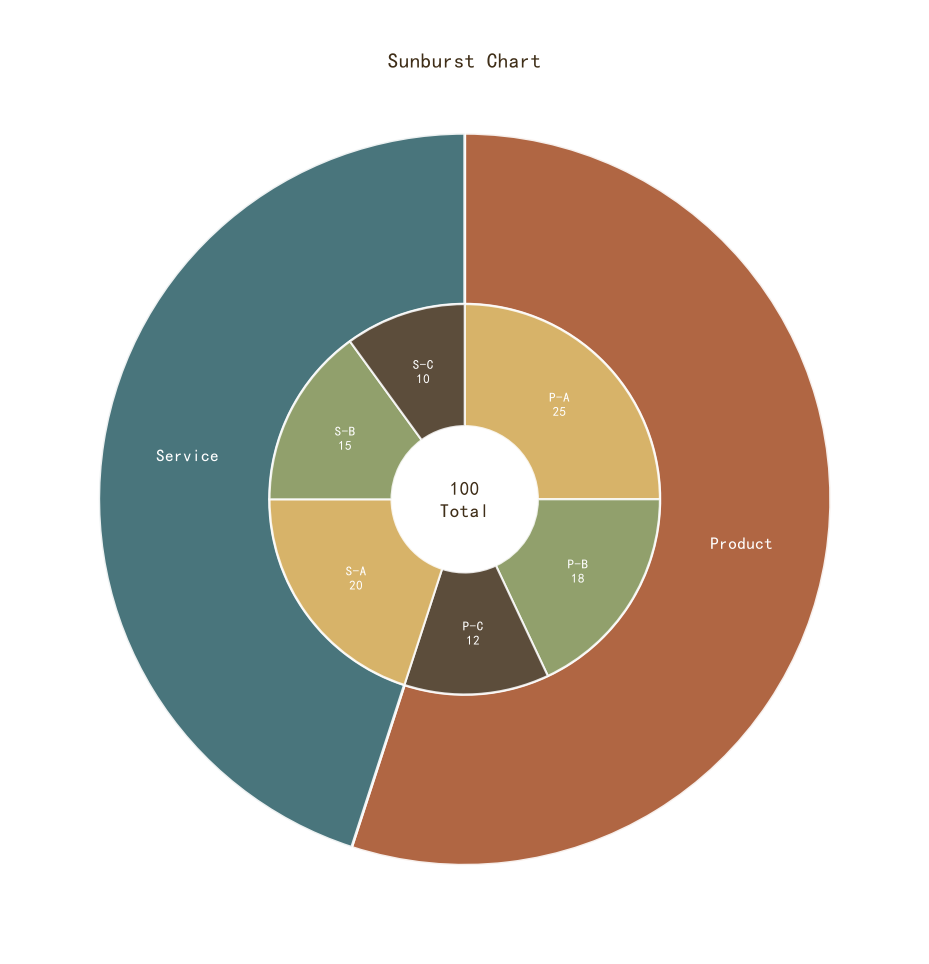
基础旭日图
Python94 行
import matplotlib.pyplot as plt
import numpy as np

COLORS = ["#A8552E", "#35666E", "#D0A64F", "#3F2E18", "#7E8F52"]
BG = "#F7F3EC"

# 层级数据:根 → 大类 → 子类
hierarchy = {
    "Product": {"P-A": 25, "P-B": 18, "P-C": 12},
    "Service": {"S-A": 20, "S-B": 15, "S-C": 10},
}

fig, ax = plt.subplots(figsize=(9, 9))

total = sum(sum(subs.values()) for subs in hierarchy.values())
start_angle = 90   # 从 12 点方向开始

# 外层:大类
inner_radius = 0.4
outer_radius = 0.75

group_angles = {}
for (group, subs), c in zip(hierarchy.items(), COLORS):
    group_total = sum(subs.values())
    angle = 360 * group_total / total
    group_angles[group] = (start_angle, start_angle - angle, c)

    wedge = plt.matplotlib.patches.Wedge(
        (0, 0), outer_radius,
        start_angle - angle, start_angle,   # 顺时针
        width=outer_radius - inner_radius,
        facecolor=c, edgecolor="white", linewidth=2.0,
        alpha=0.9,
    )
    ax.add_patch(wedge)

    # 大类标签
    mid_angle = np.deg2rad(start_angle - angle / 2)
    label_r = (inner_radius + outer_radius) / 2
    ax.text(label_r * np.cos(mid_angle),
            label_r * np.sin(mid_angle),
            group, ha="center", va="center",
            fontsize=12, color="white", fontweight="bold")

    start_angle -= angle

# 内层:子类
inner_inner_r = 0.15
inner_outer_r = 0.4

for group, subs in hierarchy.items():
    g_start = group_angles[group][0]
    group_total = sum(subs.values())

    sub_colors = [COLORS[2], COLORS[4], COLORS[3]]
    for i, (sub, val) in enumerate(subs.items()):
        angle = 360 * val / total
        c = sub_colors[i % len(sub_colors)]

        wedge = plt.matplotlib.patches.Wedge(
            (0, 0), inner_outer_r,
            g_start - angle, g_start,
            width=inner_outer_r - inner_inner_r,
            facecolor=c, edgecolor="white", linewidth=1.5,
            alpha=0.85,
        )
        ax.add_patch(wedge)

        # 子类标签(扇区够大时显示)
        if angle > 12:
            mid_angle = np.deg2rad(g_start - angle / 2)
            label_r = (inner_inner_r + inner_outer_r) / 2
            ax.text(label_r * np.cos(mid_angle),
                    label_r * np.sin(mid_angle),
                    f"{sub}\n{val}",
                    ha="center", va="center",
                    fontsize=9, color="white", fontweight="bold")

        g_start -= angle

# 中心:总量
ax.text(0, 0, f"{total}\nTotal",
        ha="center", va="center",
        fontsize=14, color=COLORS[3], fontweight="bold")

ax.set_xlim(-0.85, 0.85)
ax.set_ylim(-0.85, 0.85)
ax.set_aspect("equal")
ax.axis("off")

ax.set_title("Sunburst Chart", fontsize=15, color=COLORS[3], pad=12)

plt.tight_layout()
plt.show()三层旭日图
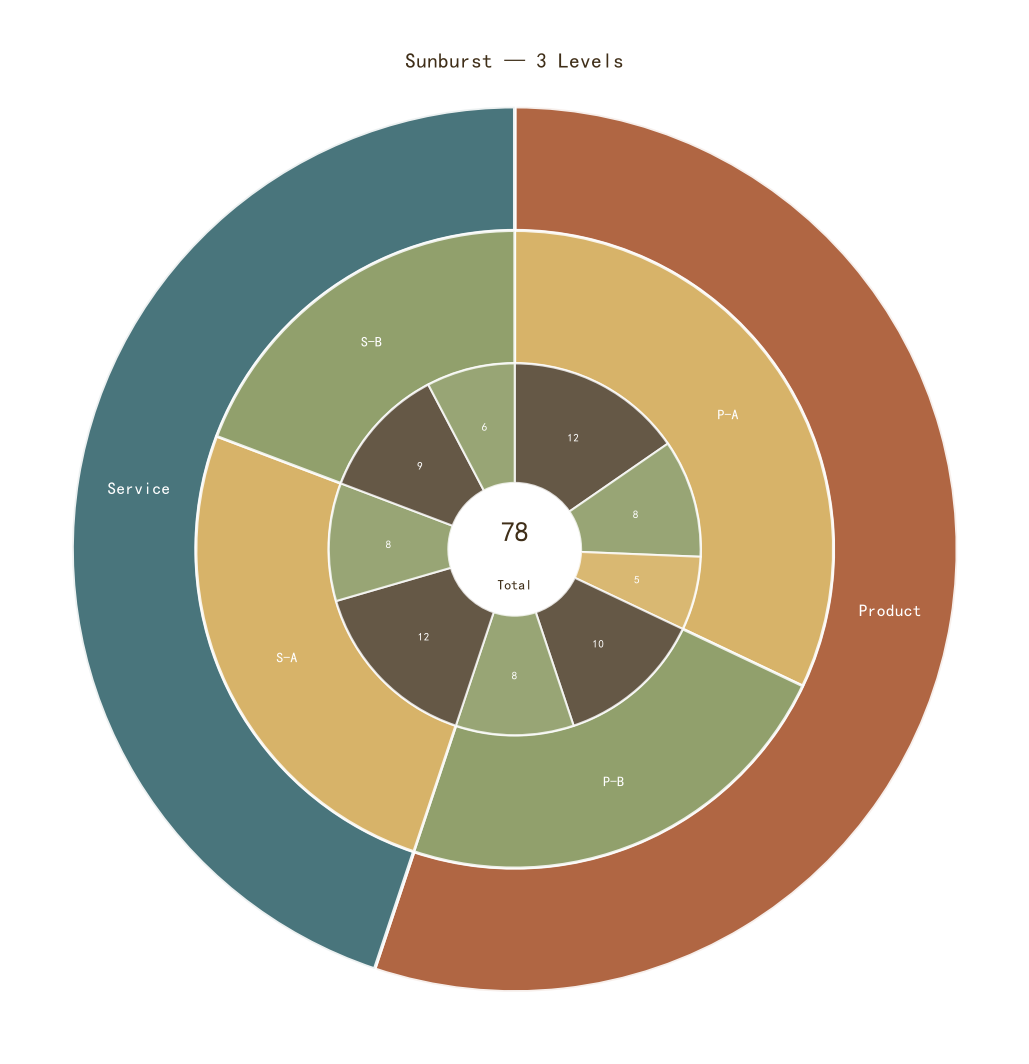
三层旭日图
Python128 行
import matplotlib.pyplot as plt
import numpy as np
from matplotlib.patches import Wedge

COLORS = ["#A8552E", "#35666E", "#D0A64F", "#3F2E18", "#7E8F52"]
BG = "#F7F3EC"

# 三层数据结构
hierarchy = {
    "Product": {
        "P-A": {"P-A-1": 12, "P-A-2": 8, "P-A-3": 5},
        "P-B": {"P-B-1": 10, "P-B-2": 8},
    },
    "Service": {
        "S-A": {"S-A-1": 12, "S-A-2": 8},
        "S-B": {"S-B-1": 9, "S-B-2": 6},
    },
}

# 计算总量
def total_value(node):
    if isinstance(node, dict):
        return sum(total_value(v) for v in node.values())
    return node

total = total_value(hierarchy)

fig, ax = plt.subplots(figsize=(10, 10))

start_angle = 90

# ---- 第 1 层:大类 ----
layer1_r = (0.72, 1.0)
group_colors = [COLORS[0], COLORS[1]]
group_angles = {}

for (group, subs), c in zip(hierarchy.items(), group_colors):
    group_total = total_value(subs)
    angle = 360 * group_total / total
    group_angles[group] = (start_angle, angle, c)

    wedge = Wedge((0, 0), layer1_r[1],
                  start_angle - angle, start_angle,
                  width=layer1_r[1] - layer1_r[0],
                  facecolor=c, edgecolor="white",
                  linewidth=2.5, alpha=0.9)
    ax.add_patch(wedge)

    mid = np.deg2rad(start_angle - angle / 2)
    lr = sum(layer1_r) / 2
    ax.text(lr * np.cos(mid), lr * np.sin(mid),
            group, ha="center", va="center",
            fontsize=12, color="white", fontweight="bold")

    start_angle -= angle

# ---- 第 2 层:子类 ----
layer2_r = (0.42, 0.72)
sub_colors = [COLORS[2], COLORS[4], COLORS[3]]
sub_angles = {}

for group, subs in hierarchy.items():
    g_start = group_angles[group][0]
    for i, (sub, leaves) in enumerate(subs.items()):
        sub_total = total_value(leaves)
        angle = 360 * sub_total / total
        c = sub_colors[i % len(sub_colors)]
        sub_angles[(group, sub)] = (g_start, angle)

        wedge = Wedge((0, 0), layer2_r[1],
                      g_start - angle, g_start,
                      width=layer2_r[1] - layer2_r[0],
                      facecolor=c, edgecolor="white",
                      linewidth=2.0, alpha=0.85)
        ax.add_patch(wedge)

        if angle > 15:
            mid = np.deg2rad(g_start - angle / 2)
            lr = sum(layer2_r) / 2
            ax.text(lr * np.cos(mid), lr * np.sin(mid),
                    sub, ha="center", va="center",
                    fontsize=10, color="white", fontweight="bold")

        g_start -= angle

# ---- 第 3 层:叶子 ----
layer3_r = (0.15, 0.42)
leaf_colors = [COLORS[3], COLORS[4], COLORS[2], COLORS[0], COLORS[1]]

for group, subs in hierarchy.items():
    for sub, leaves in subs.items():
        s_start = sub_angles[(group, sub)][0]
        for i, (leaf, val) in enumerate(leaves.items()):
            angle = 360 * val / total
            c = leaf_colors[i % len(leaf_colors)]

            wedge = Wedge((0, 0), layer3_r[1],
                          s_start - angle, s_start,
                          width=layer3_r[1] - layer3_r[0],
                          facecolor=c, edgecolor="white",
                          linewidth=1.5, alpha=0.8)
            ax.add_patch(wedge)

            if angle > 10:
                mid = np.deg2rad(s_start - angle / 2)
                lr = sum(layer3_r) / 2
                ax.text(lr * np.cos(mid), lr * np.sin(mid),
                        f"{val}", ha="center", va="center",
                        fontsize=8, color="white", fontweight="bold")

            s_start -= angle

# 中心
ax.text(0, 0.04, f"{total}", ha="center", va="center",
        fontsize=20, color=COLORS[3], fontweight="bold")
ax.text(0, -0.08, "Total", ha="center", va="center",
        fontsize=10, color=COLORS[3])

ax.set_xlim(-1.05, 1.05)
ax.set_ylim(-1.05, 1.05)
ax.set_aspect("equal")
ax.axis("off")

ax.set_title("Sunburst — 3 Levels",
             fontsize=15, color=COLORS[3], pad=12)

plt.tight_layout()
plt.show()Plotly 交互式旭日图
Plotly 交互式旭日图
Python33 行
# pip install plotly
import plotly.express as px
import pandas as pd

data = {
    "Group": ["Product", "Product", "Product",
              "Service", "Service", "Service"],
    "Sub": ["P-A", "P-B", "P-C", "S-A", "S-B", "S-C"],
    "Value": [25, 18, 12, 20, 15, 10],
}

df = pd.DataFrame(data)

fig = px.sunburst(
    df,
    path=["Group", "Sub"],          # 层级路径
    values="Value",
    color="Group",
    color_discrete_map={
        "Product": "#A8552E",
        "Service": "#35666E",
    },
    branchvalues="total",
)

fig.update_layout(
    title="Interactive Sunburst (Plotly)",
    paper_bgcolor="#F7F3EC",
    plot_bgcolor="#F7F3EC",
    font=dict(color="#3F2E18", size=12),
)

fig.write_html("sunburst.html")单色渐变旭日图
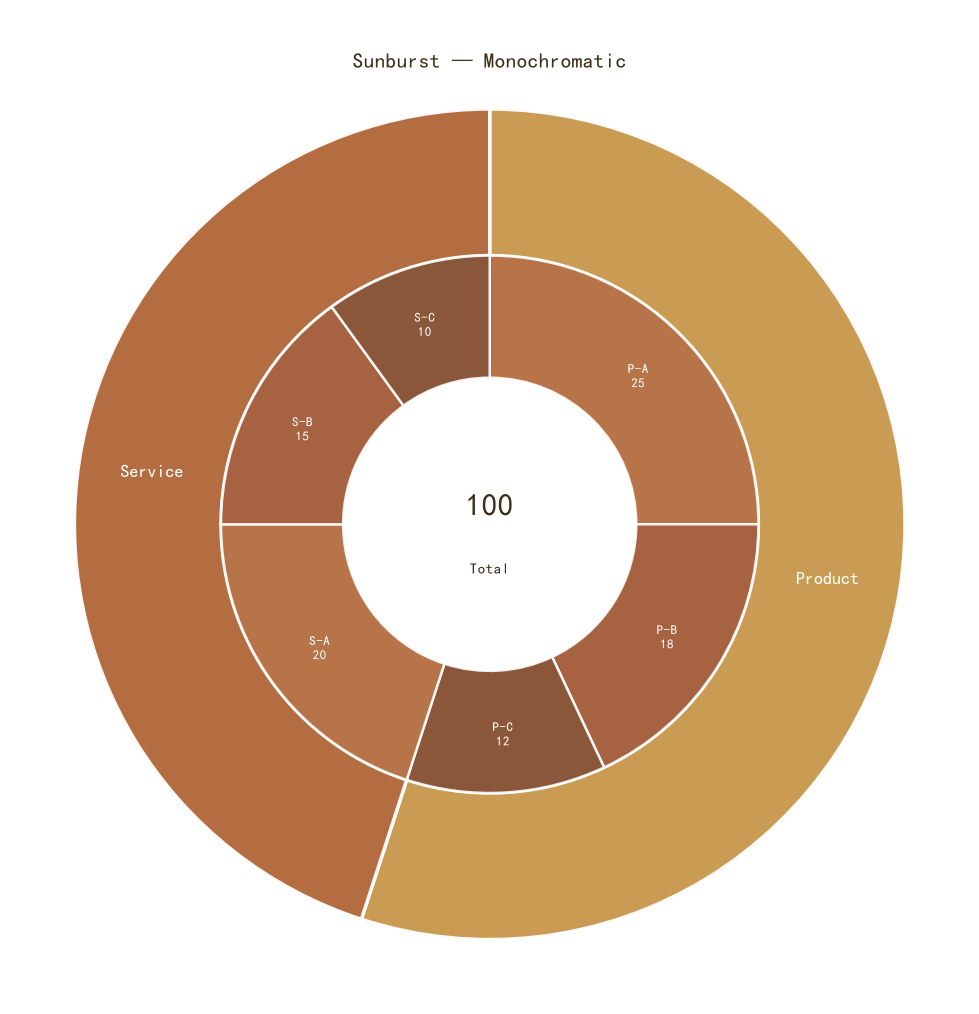
单色渐变旭日图
Python73 行
import matplotlib.pyplot as plt
import numpy as np
from matplotlib.patches import Wedge
from matplotlib.colors import LinearSegmentedColormap

BG = "#F7F3EC"
CMAP = LinearSegmentedColormap.from_list(
    "theme", ["#3F2E18", "#A8552E", "#D0A64F"], N=256
)

hierarchy = {
    "Product": {"P-A": 25, "P-B": 18, "P-C": 12},
    "Service": {"S-A": 20, "S-B": 15, "S-C": 10},
}
total = sum(sum(v.values()) for v in hierarchy.values())

fig, ax = plt.subplots(figsize=(9.5, 9.5))

start = 90

# 外层:大类
for i, (group, subs) in enumerate(hierarchy.items()):
    group_total = sum(subs.values())
    angle = 360 * group_total / total
    c = CMAP(0.9 - i * 0.3)

    wedge = Wedge((0, 0), 0.85, start - angle, start,
                  width=0.3, facecolor=c,
                  edgecolor="white", linewidth=2.5, alpha=0.95)
    ax.add_patch(wedge)

    mid = np.deg2rad(start - angle / 2)
    ax.text(0.7 * np.cos(mid), 0.7 * np.sin(mid),
            group, ha="center", va="center",
            fontsize=13, color="white", fontweight="bold")

    # 内层:子类
    s_start = start
    for j, (sub, val) in enumerate(subs.items()):
        sub_angle = 360 * val / total
        c_sub = CMAP(0.6 - j * 0.15)

        wedge = Wedge((0, 0), 0.55, s_start - sub_angle, s_start,
                      width=0.25, facecolor=c_sub,
                      edgecolor="white", linewidth=1.8, alpha=0.9)
        ax.add_patch(wedge)

        if sub_angle > 15:
            mid = np.deg2rad(s_start - sub_angle / 2)
            ax.text(0.43 * np.cos(mid), 0.43 * np.sin(mid),
                    f"{sub}\n{val}", ha="center", va="center",
                    fontsize=9, color="white", fontweight="bold")

        s_start -= sub_angle

    start -= angle

# 中心
ax.text(0, 0.04, f"{total}", ha="center", va="center",
        fontsize=22, color="#3F2E18", fontweight="bold")
ax.text(0, -0.09, "Total", ha="center", va="center",
        fontsize=11, color="#3F2E18")

ax.set_xlim(-0.9, 0.9)
ax.set_ylim(-0.9, 0.9)
ax.set_aspect("equal")
ax.axis("off")

ax.set_title("Sunburst — Monochromatic",
             fontsize=15, color="#3F2E18", pad=12)

plt.tight_layout()
plt.show()