HIVE
绘图 · 第 35 / 36 章
基础蜂巢图
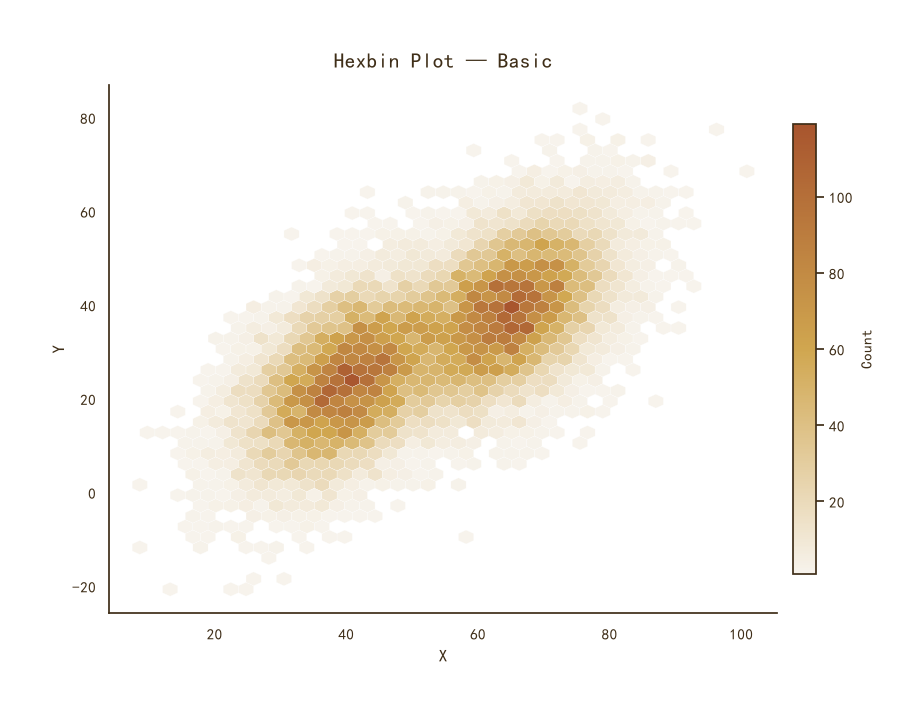
基础蜂巢图
Python47 行
import matplotlib.pyplot as plt
import numpy as np
from matplotlib.colors import LinearSegmentedColormap

BG = "#F7F3EC"
CMAP = LinearSegmentedColormap.from_list(
    "theme", ["#F7F3EC", "#D0A64F", "#A8552E"], N=256
)

np.random.seed(42)
n = 20000
# 双峰数据
x = np.concatenate([
    np.random.normal(40, 8, n // 2),
    np.random.normal(65, 8, n // 2),
])
y = 0.6 * x + np.random.normal(0, 10, n)

fig, ax = plt.subplots(figsize=(9, 6.5))

hb = ax.hexbin(
    x, y,
    gridsize=40,
    cmap=CMAP,
    mincnt=1,               # 空网格不填色
    linewidths=0.2,
    edgecolors="white",
)

cbar = fig.colorbar(hb, ax=ax, shrink=0.85, pad=0.02)
cbar.set_label("Count", fontsize=11, color="#3F2E18")
cbar.ax.tick_params(colors="#3F2E18")
cbar.outline.set_edgecolor("#3F2E18")

ax.set_title("Hexbin Plot — Basic",
             fontsize=15, color="#3F2E18", pad=12)
ax.set_xlabel("X", fontsize=12, color="#3F2E18")
ax.set_ylabel("Y", fontsize=12, color="#3F2E18")
ax.tick_params(axis="both", colors="#3F2E18")

for s in ("top", "right"):
    ax.spines[s].set_visible(False)
ax.spines["left"].set_color("#3F2E18")
ax.spines["bottom"].set_color("#3F2E18")

plt.tight_layout()
plt.show()对数色标
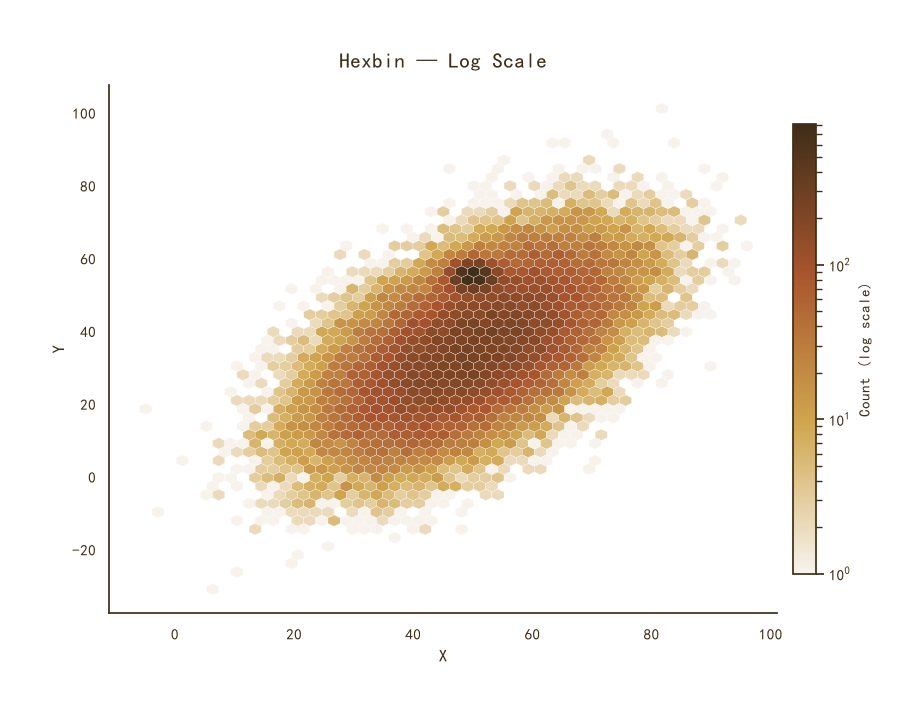
对数色标
Python47 行
import matplotlib.pyplot as plt
import numpy as np
from matplotlib.colors import LinearSegmentedColormap

BG = "#F7F3EC"
CMAP = LinearSegmentedColormap.from_list(
    "theme", ["#F7F3EC", "#D0A64F", "#A8552E", "#3F2E18"], N=256
)

np.random.seed(0)
n = 50000
x = np.random.normal(50, 12, n)
y = 0.7 * x + np.random.normal(0, 12, n)
# 加一个高密度核心
x[:5000] = np.random.normal(50, 2, 5000)
y[:5000] = np.random.normal(55, 2, 5000)

fig, ax = plt.subplots(figsize=(9, 6.5))

hb = ax.hexbin(
    x, y,
    gridsize=50,
    cmap=CMAP,
    bins="log",             # 对数色标
    mincnt=1,
    linewidths=0.2,
    edgecolors="white",
)

cbar = fig.colorbar(hb, ax=ax, shrink=0.85, pad=0.02)
cbar.set_label("Count (log scale)", fontsize=11, color="#3F2E18")
cbar.ax.tick_params(colors="#3F2E18")
cbar.outline.set_edgecolor("#3F2E18")

ax.set_title("Hexbin — Log Scale",
             fontsize=15, color="#3F2E18", pad=12)
ax.set_xlabel("X", fontsize=12, color="#3F2E18")
ax.set_ylabel("Y", fontsize=12, color="#3F2E18")
ax.tick_params(axis="both", colors="#3F2E18")

for s in ("top", "right"):
    ax.spines[s].set_visible(False)
ax.spines["left"].set_color("#3F2E18")
ax.spines["bottom"].set_color("#3F2E18")

plt.tight_layout()
plt.show()按均值着色
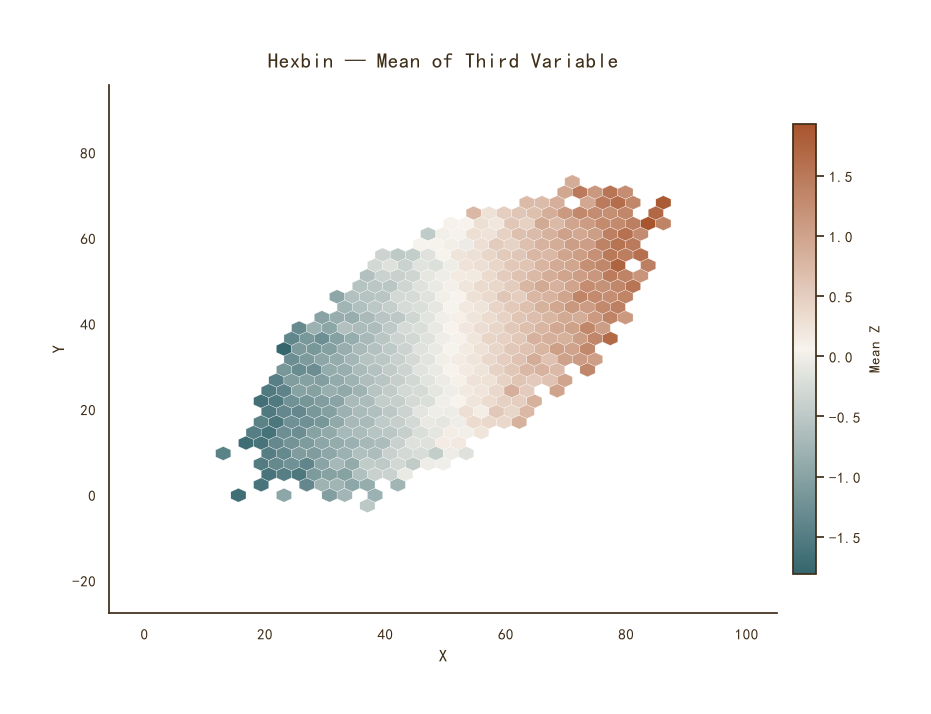
按均值着色
Python46 行
import matplotlib.pyplot as plt
import numpy as np
from matplotlib.colors import LinearSegmentedColormap

BG = "#F7F3EC"
CMAP = LinearSegmentedColormap.from_list(
    "theme", ["#35666E", "#F7F3EC", "#A8552E"], N=256   # 发散色
)

np.random.seed(1)
n = 30000
x = np.random.normal(50, 12, n)
y = 0.7 * x + np.random.normal(0, 10, n)
# 第三个变量:与位置相关
z = (x - 50) / 20 + np.random.normal(0, 0.5, n)

fig, ax = plt.subplots(figsize=(9, 6.5))

hb = ax.hexbin(
    x, y, C=z,              # 用 z 的均值着色
    gridsize=40,
    cmap=CMAP,
    reduce_C_function=np.mean,   # 默认是 np.mean
    mincnt=5,               # 至少 5 个点才着色,避免噪声
    linewidths=0.2,
    edgecolors="white",
)

cbar = fig.colorbar(hb, ax=ax, shrink=0.85, pad=0.02)
cbar.set_label("Mean Z", fontsize=11, color="#3F2E18")
cbar.ax.tick_params(colors="#3F2E18")
cbar.outline.set_edgecolor("#3F2E18")

ax.set_title("Hexbin — Mean of Third Variable",
             fontsize=15, color="#3F2E18", pad=12)
ax.set_xlabel("X", fontsize=12, color="#3F2E18")
ax.set_ylabel("Y", fontsize=12, color="#3F2E18")
ax.tick_params(axis="both", colors="#3F2E18")

for s in ("top", "right"):
    ax.spines[s].set_visible(False)
ax.spines["left"].set_color("#3F2E18")
ax.spines["bottom"].set_color("#3F2E18")

plt.tight_layout()
plt.show()带边际分布的蜂巢图
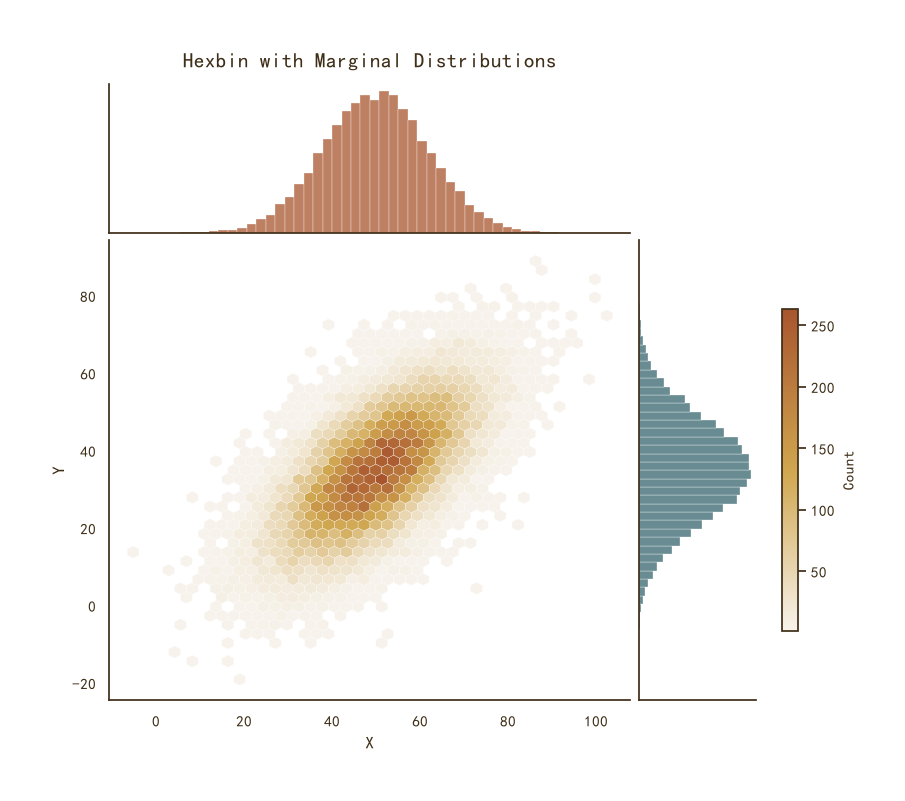
带边际分布的蜂巢图
Python60 行
import matplotlib.pyplot as plt
import numpy as np
from matplotlib.colors import LinearSegmentedColormap
from matplotlib.gridspec import GridSpec

BG = "#F7F3EC"
CMAP = LinearSegmentedColormap.from_list(
    "theme", ["#F7F3EC", "#D0A64F", "#A8552E"], N=256
)

np.random.seed(3)
n = 30000
x = np.random.normal(50, 12, n)
y = 0.7 * x + np.random.normal(0, 10, n)

fig = plt.figure(figsize=(9, 8))
gs = GridSpec(4, 4, figure=fig, hspace=0.05, wspace=0.05)

ax_main = fig.add_subplot(gs[1:, :-1])
ax_top  = fig.add_subplot(gs[0, :-1], sharex=ax_main)
ax_right = fig.add_subplot(gs[1:, -1], sharey=ax_main)

for a in (ax_main, ax_top, ax_right):
    a.tick_params(colors="#3F2E18")
    for s in ("top", "right"):
        a.spines[s].set_visible(False)
    a.spines["left"].set_color("#3F2E18")
    a.spines["bottom"].set_color("#3F2E18")

# 主蜂巢图
hb = ax_main.hexbin(x, y, gridsize=40, cmap=CMAP,
                    mincnt=1, linewidths=0.2,
                    edgecolors="white")

# 顶部直方图
ax_top.hist(x, bins=50, color="#A8552E",
            alpha=0.75, edgecolor="white", linewidth=0.3)
ax_top.tick_params(labelbottom=False)
ax_top.set_yticks([])

# 右侧直方图
ax_right.hist(y, bins=50, orientation="horizontal",
              color="#35666E", alpha=0.75,
              edgecolor="white", linewidth=0.3)
ax_right.tick_params(labelleft=False)
ax_right.set_xticks([])

cbar = fig.colorbar(hb, ax=ax_right, shrink=0.7, pad=0.15)
cbar.set_label("Count", fontsize=11, color="#3F2E18")
cbar.ax.tick_params(colors="#3F2E18")
cbar.outline.set_edgecolor("#3F2E18")

ax_main.set_xlabel("X", fontsize=12, color="#3F2E18")
ax_main.set_ylabel("Y", fontsize=12, color="#3F2E18")

ax_top.set_title("Hexbin with Marginal Distributions",
                 fontsize=15, color="#3F2E18", pad=12)

plt.tight_layout()
plt.show()