文章Matplotlib第 2 章
子图与布局
Matplotlib · 第 2 / 43 章
plt.subplots
创建画布 Figure,并在画布中创建一个或多个子图 Axes。
fig, ax = plt.subplots(
    nrows=1,                 # 子图的行数
    ncols=1,                 # 子图的列数
    figsize=None,            # 整张画布的尺寸,单位为英寸,如figsize=(10, 6)
    sharex=False,            # 是否共享 X 轴
    sharey=False,            # 是否共享 Y 轴
    squeeze=True,            # 是否压缩返回的 Axes 数组维度
    layout=None              # 自动布局设置
)以下是各种示例:
import matplotlib.pyplot as plt
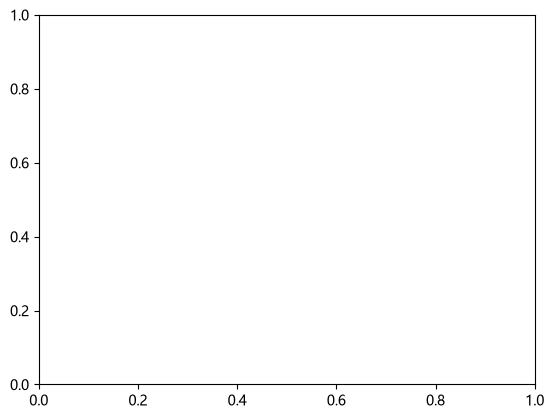
fig, ax = plt.subplots()
因为还没有在画布上绘制任何东西,运行上面这段代码后不会出现任何东西,以下只是示意图
fig, axs = plt.subplots(2, 3) 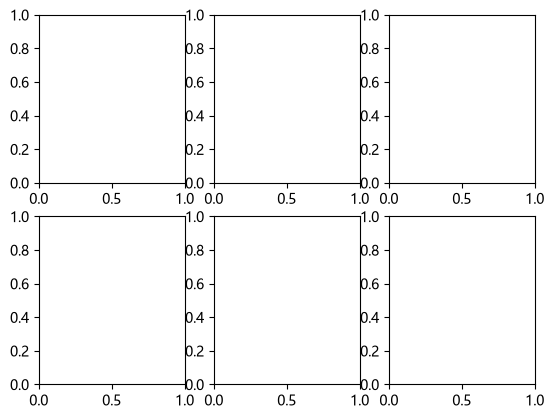
fig, ax = plt.subplots(2, 2, sharex=True, sharey=True)       # 所有子图共享轴
#sharex 和 sharey 除了 True/False,还支持 'row'、'col'、'all'、'none'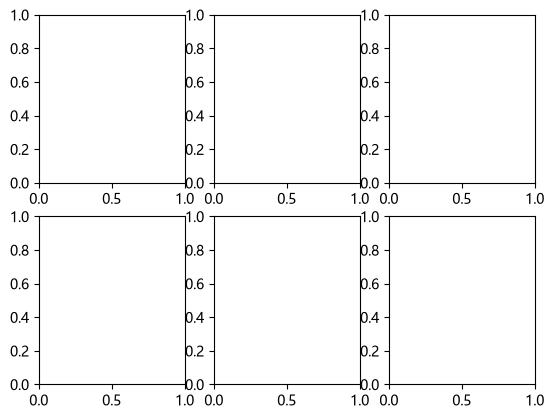
#同一行的子图共享 x 轴, 同一列的子图共享 y 轴。
fig, axs = plt.subplots(2, 2, sharex='row', sharey='col') 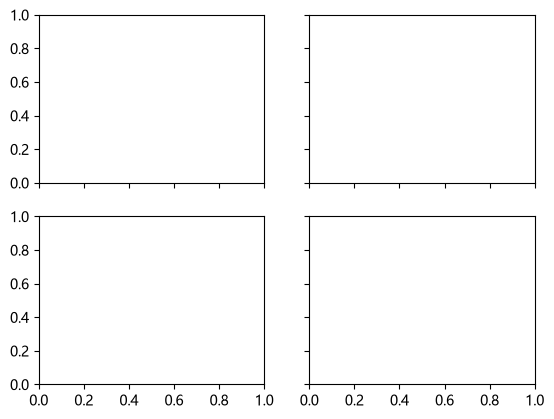
fig, axs = plt.subplots(2, 2, sharex='col', sharey='col')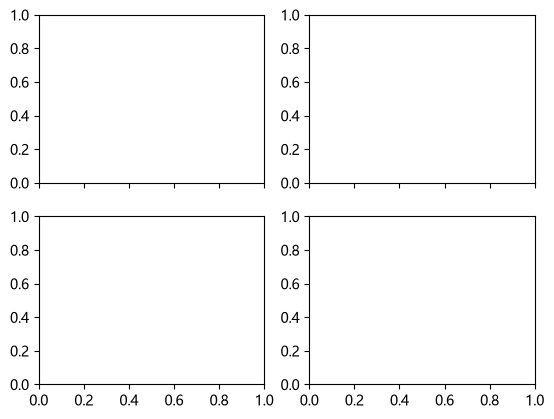
fig, axs = plt.subplots(1, 2, figsize=(10, 4), width_ratios=[2, 1]) # 列宽比 2:1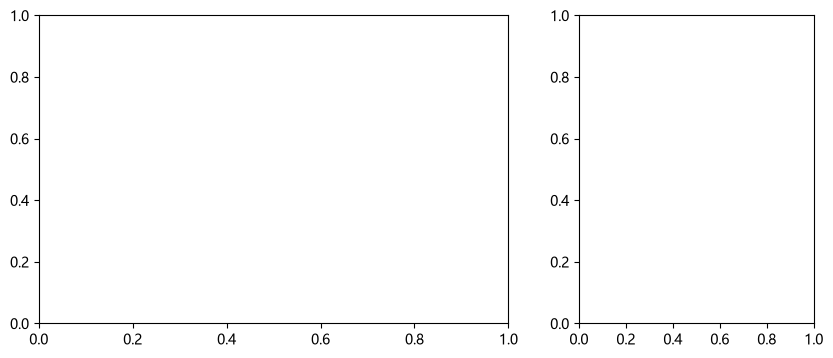
fig, axs = plt.subplots(2, 1, height_ratios=[3, 1]) # 行高比 3:1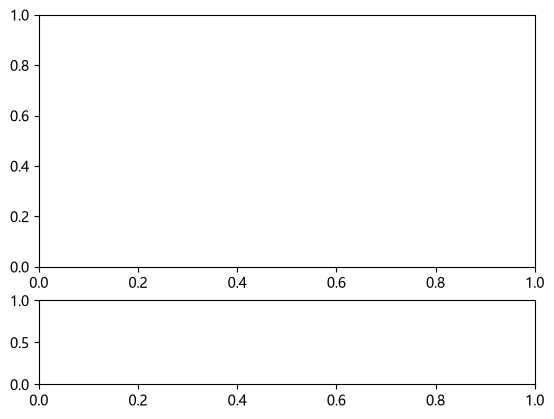
关于 squeeze 参数
squeeze 控制 plt.subplots() 返回的子图对象 axs 是否自动降维。默认 squeeze=True,Matplotlib 会移除长度为 1 的维度:
| 调用方式 | axs 的返回形式 |
|---|---|
plt.subplots(1, 1) |
单个 Axes 对象 |
plt.subplots(1, 3) |
一维数组 |
plt.subplots(3, 1) |
一维数组 |
plt.subplots(2, 3) |
二维数组 |
设置 squeeze=False,则始终返回二维数组:
fig, axs = plt.subplots(2, 3, squeeze=False)此时 axs.shape == (2, 3),可以统一使用 axs[i, j] 访问子图。
编写需要适应不同子图行列数的通用函数时,使用 squeeze=False,确保索引方式始终一致,避免因返回维度变化而报错。
def plot_grid(nrows, ncols, data):
    fig, axs = plt.subplots(nrows, ncols, squeeze=False)

    for i in range(nrows):
        for j in range(ncols):
            axs[i, j].plot(data)

return fig, axsadd_axes 与 add_subplot
当已经创建了 Figure,想手动添加子图时,可以使用add_subplot()和add_axes(),两者的区别在于定位方式。
import matplotlib.pyplot as plt

fig = plt.figure(figsize=(6, 4))
ax1 = fig.add_axes([0.0, 0.0, 0.6, 1.0])   # [左边界, 下边界, 宽, 高],全是 0–1 的画布比例
ax2 = fig.add_axes([0.7, 0.2, 0.25, 0.5])

ax3 = fig.add_subplot(2, 2, 4)     # 用 GridSpec 定位,返回占满第 2×2 区域的 Axes
ax4 = fig.add_subplot(3, 1, (2, 2))# 占第 2 行整行(slice 语法)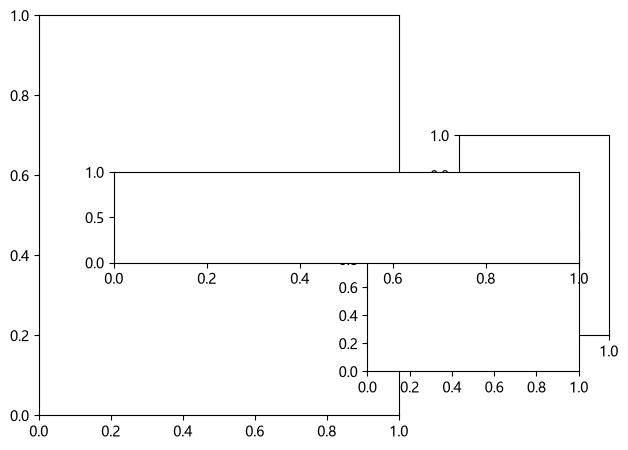
GridSpec:非均匀网格
import matplotlib.pyplot as plt
import numpy as np

fig = plt.figure(figsize=(8, 5))
gs = fig.add_gridspec(
    3, 3,                        # 在 fig 上创建一个 3 行 3 列的网格
    height_ratios=[1, 1, 0.5],   # 三行高度比为 1 : 1 : 0.5
    width_ratios=[1, 1, 0.6],    # 三列宽度比为 1 : 1 : 0.6
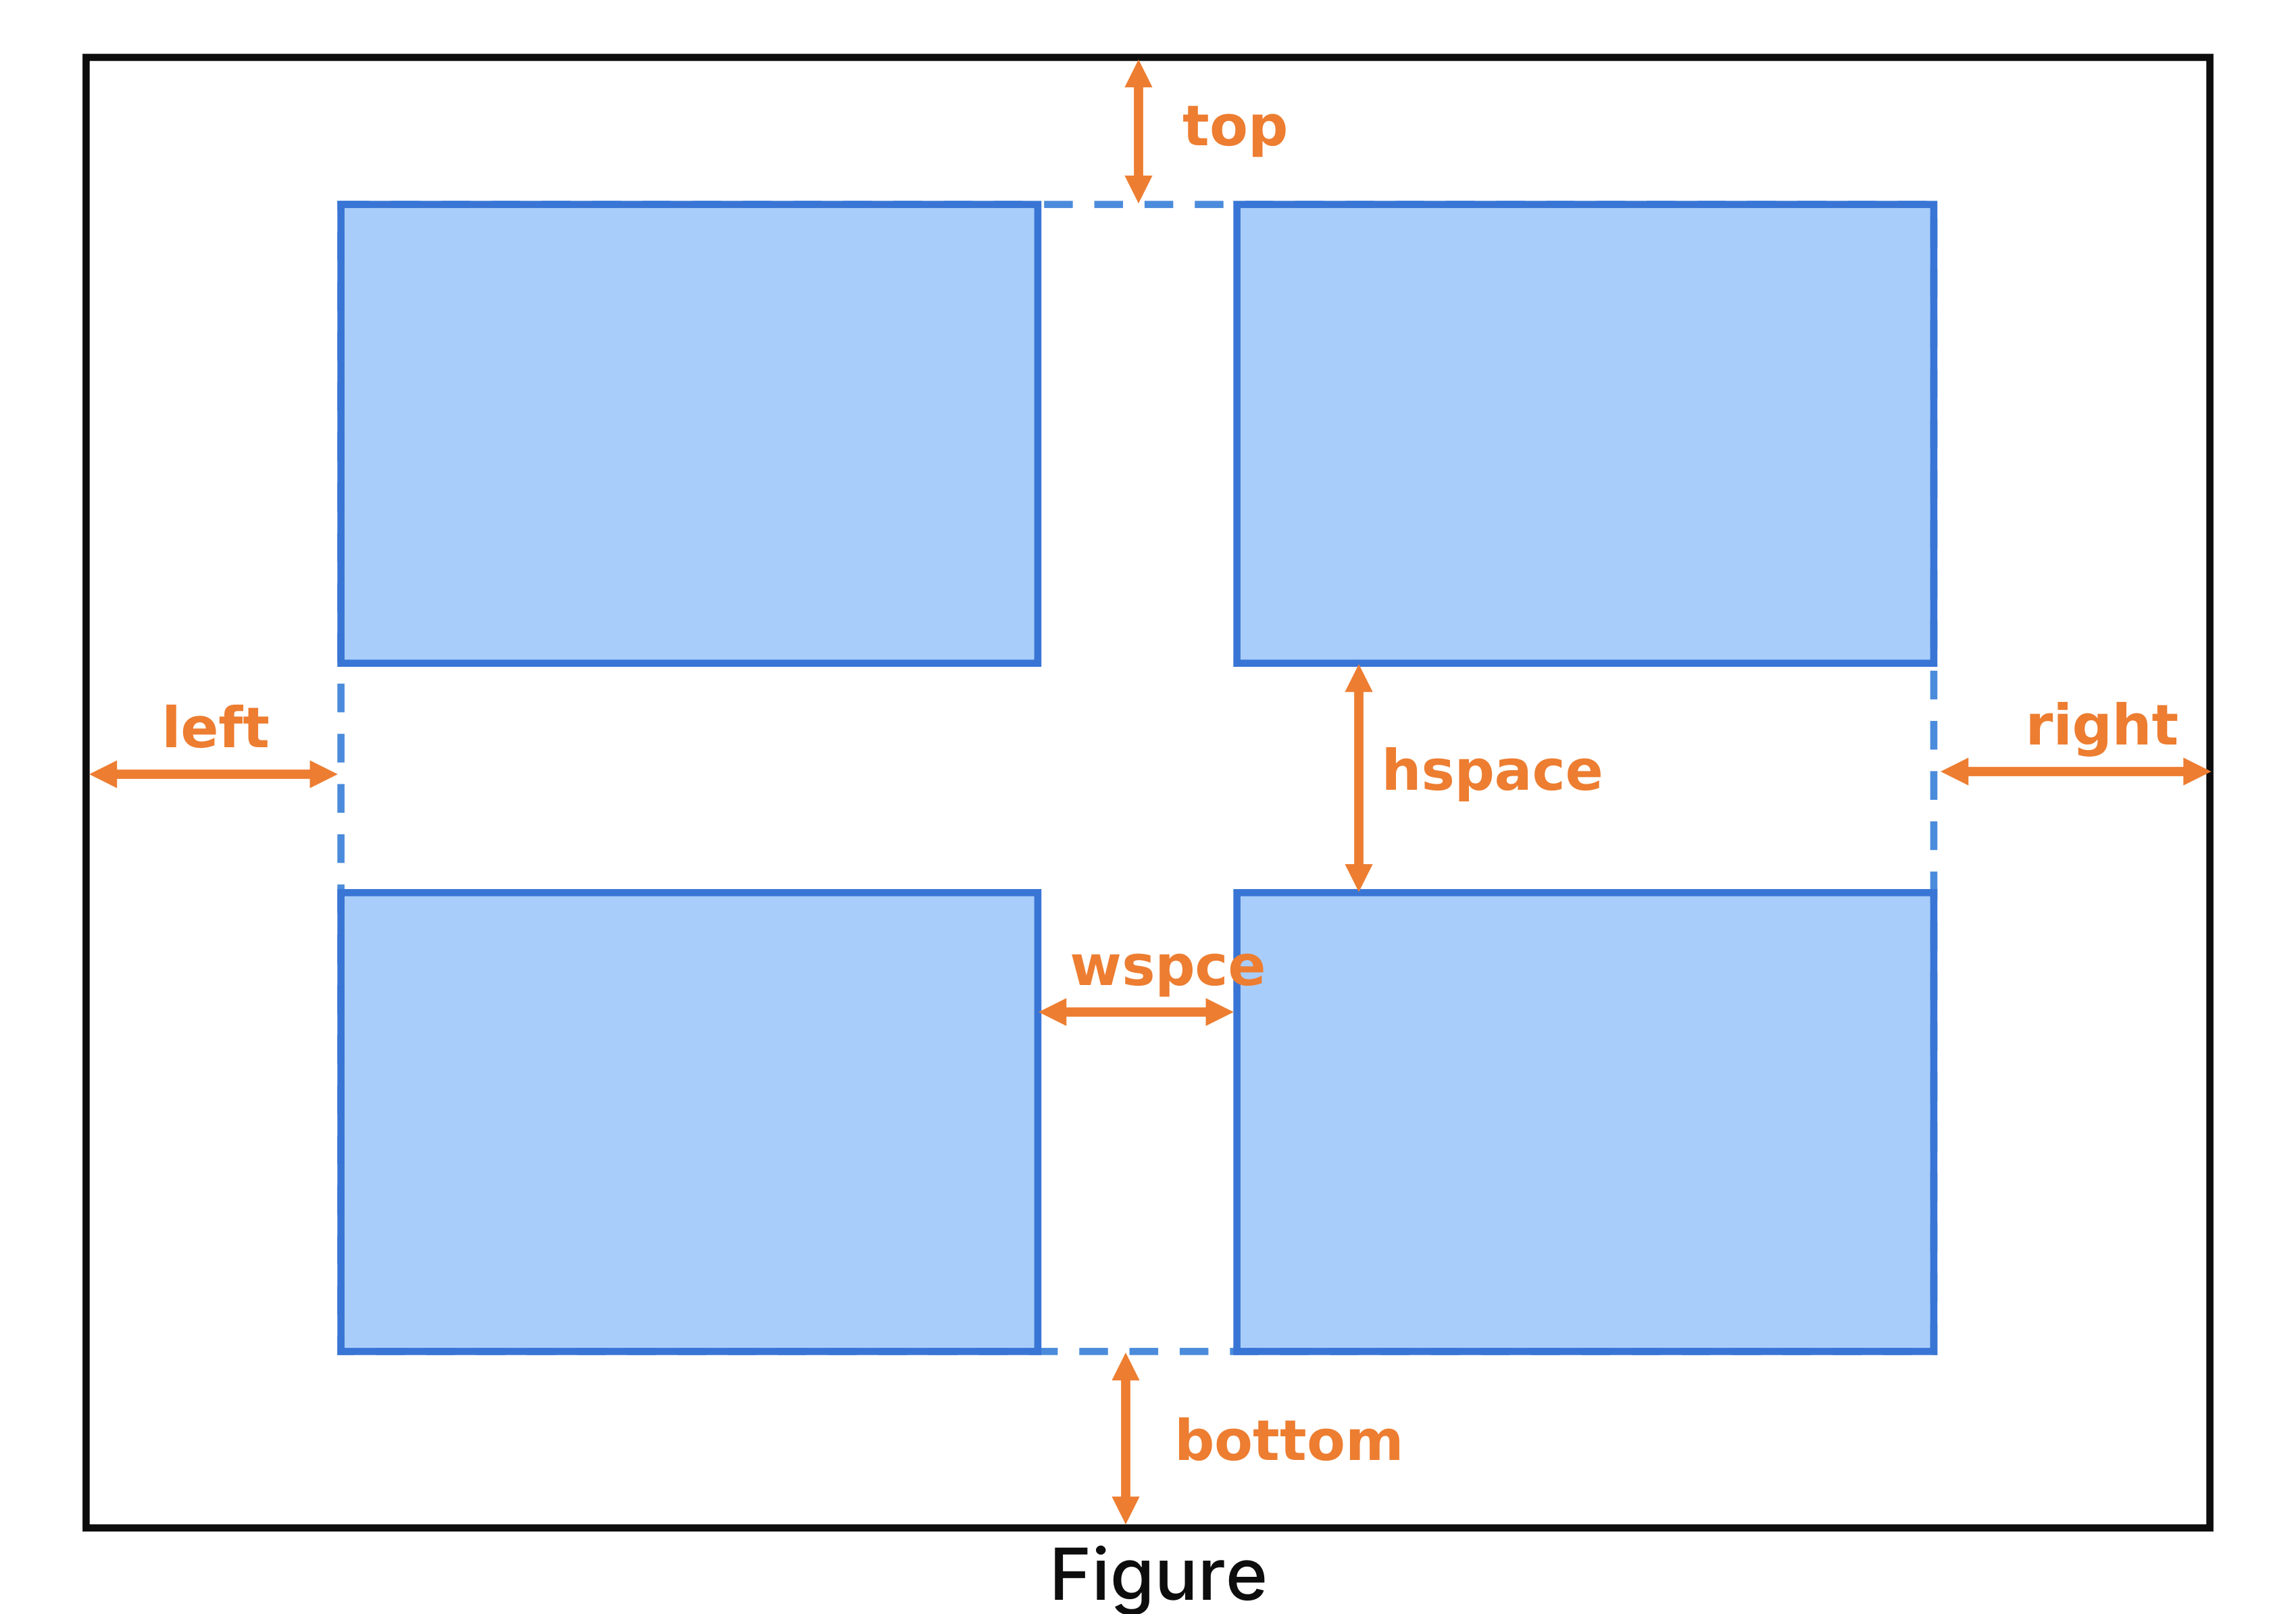
    hspace=0.4, wspace=0.3,      # 行间距,列间距
    left=.07, right=.97, top=.92, bottom=.08  #网格整体在画布中的边距
)

# 可视化布局情况
for i in range(3):
    for j in range(3):
        ax = fig.add_subplot(gs[i, j])
        ax.set_title(f'({i},{j})')

plt.show()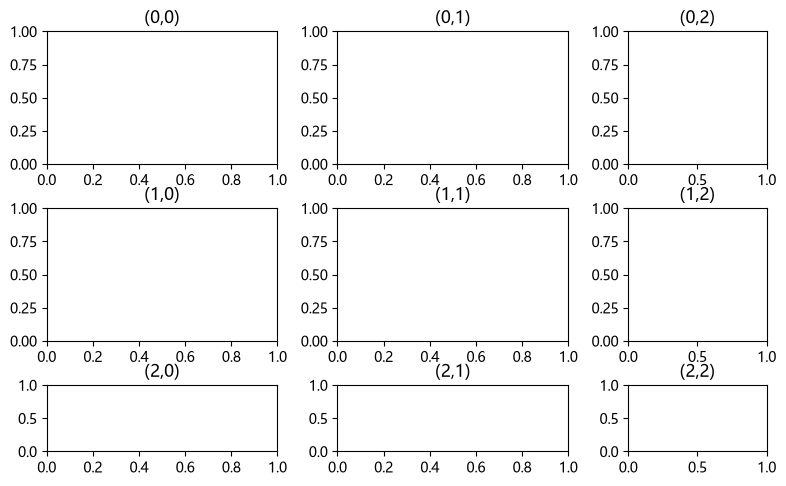
import matplotlib.pyplot as plt
import numpy as np

fig = plt.figure(figsize=(8, 5))
gs = fig.add_gridspec(
    3, 3,                        # 在 fig 上创建一个 3 行 3 列的网格
    height_ratios=[1, 1, 0.5],   # 三行高度比为 1 : 1 : 0.5
    width_ratios=[1, 1, 0.6],    # 三列宽度比为 1 : 1 : 0.6
    hspace=0.4, wspace=0.3,      # 行间距,列间距
    left=.07, right=.97, top=.92, bottom=.08  #网格整体在画布中的边距
)

ax_a = fig.add_subplot(gs[0, 0:2])      # 第 0 行,第 0~1 列,跨两列
ax_b = fig.add_subplot(gs[0, 2])        # 第 0 行,第 2 列
ax_c = fig.add_subplot(gs[1, :])        # 第 1 行,所有列
ax_d = fig.add_subplot(gs[2, 0:3])      # 第 2 行,所有列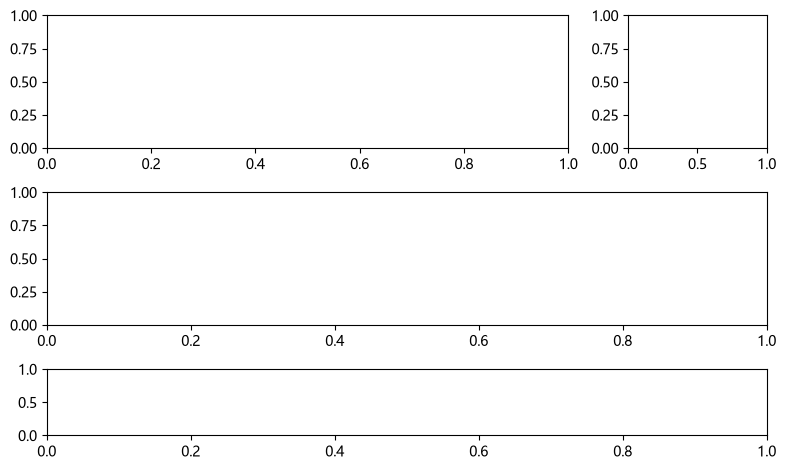
import matplotlib.pyplot as plt
import numpy as np

fig = plt.figure(figsize=(8, 5))
gs = fig.add_gridspec(
    3, 3,
    height_ratios=[1, 1, 0.5],
    width_ratios=[1, 1, 0.6],
    hspace=0.4, wspace=0.3,
    left=.07, right=.97, top=.92, bottom=.08
)

ax_a = fig.add_subplot(gs[0, 0:2])
ax_b = fig.add_subplot(gs[0, 2])
ax_c = fig.add_subplot(gs[1, :])
ax_d = fig.add_subplot(gs[2, 0:3])

gs2 = fig.add_gridspec(1, 2, width_ratios=[1, 1], wspace=0.05)
ax_e = fig.add_subplot(gs2[0])
ax_f = fig.add_subplot(gs2[1], sharey=ax_e)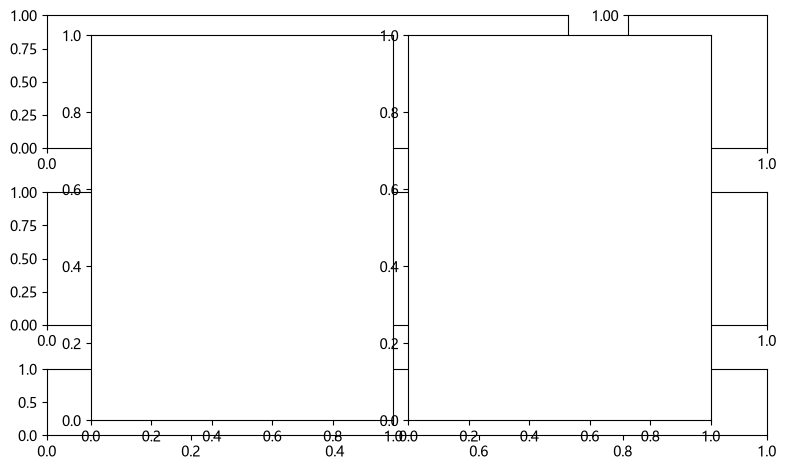
subplot_mosaic
subplot_mosaic:直接用字符画布局,最直观的新写法。
import matplotlib.pyplot as plt

# 传入的是一个二维列表,每个字符串代表一个格子。相同名字的格子会合并成一个 Axes
fig, axd = plt.subplot_mosaic([['left', 'top'], ['left', 'right']],
                              figsize=(6, 4), layout='constrained')
for name, ax in axd.items():
    ax.set_title(name)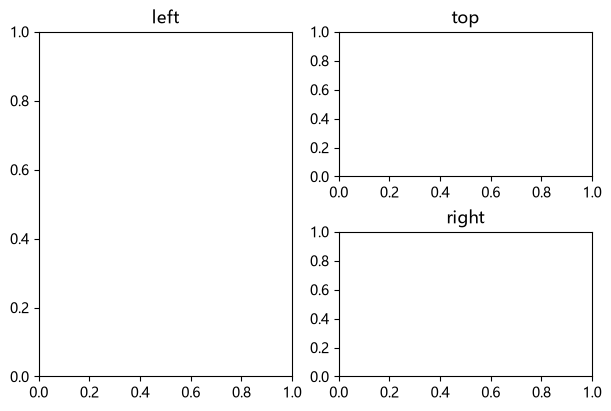
# 同一张网格里多种跨度的混排
fig, axd = plt.subplot_mosaic([['A', 'A', 'B'], ['C', 'D', 'B']],
                              height_ratios=[2, 1])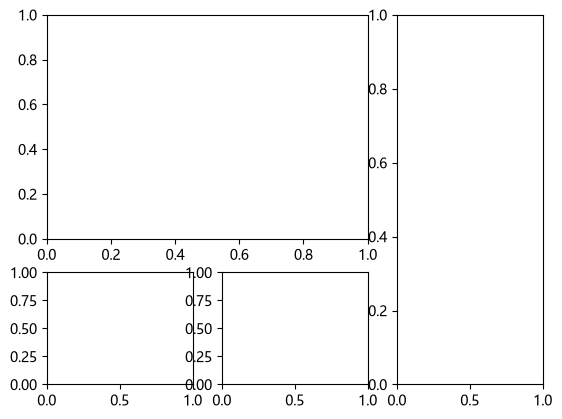
# subplot_mosaic 没有 squeeze 参数(返回的始终是 dict);多余 kwarg 会透传给 Figure 而报错
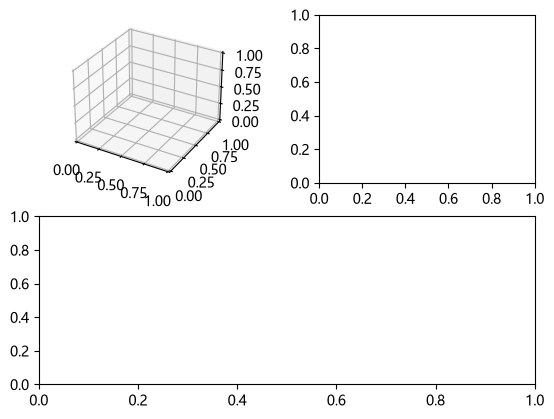
# 也可以给不同的格子不同的投影/设置
fig, axd = plt.subplot_mosaic([['A', 'B'], ['C', 'C']],
                              gridspec_kw={'wspace': .3}, #列与列之间的水平间距等于平均列宽的 30%
per_subplot_kw={'A': {'projection': '3d'}})字符含义:S 必须出现且可重复(同一格拆成多个子区),数字 123 表示第 n 格(需 empty_sentinel=None),. 或 'None' 表示留空。
import matplotlib.pyplot as plt
fig, axs = plt.subplots(1, 2, subplot_kw={'projection': 'polar'})     # 极坐标子图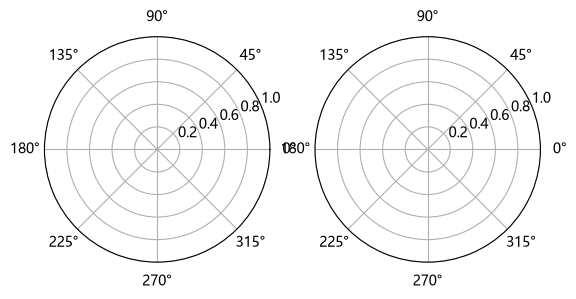
fig = plt.figure(); ax3d = fig.add_subplot(projection='3d') # 3D 子图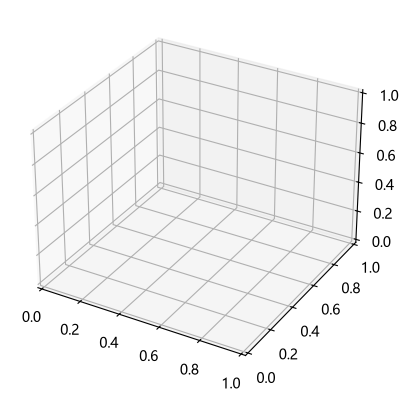
inset:图内嵌图
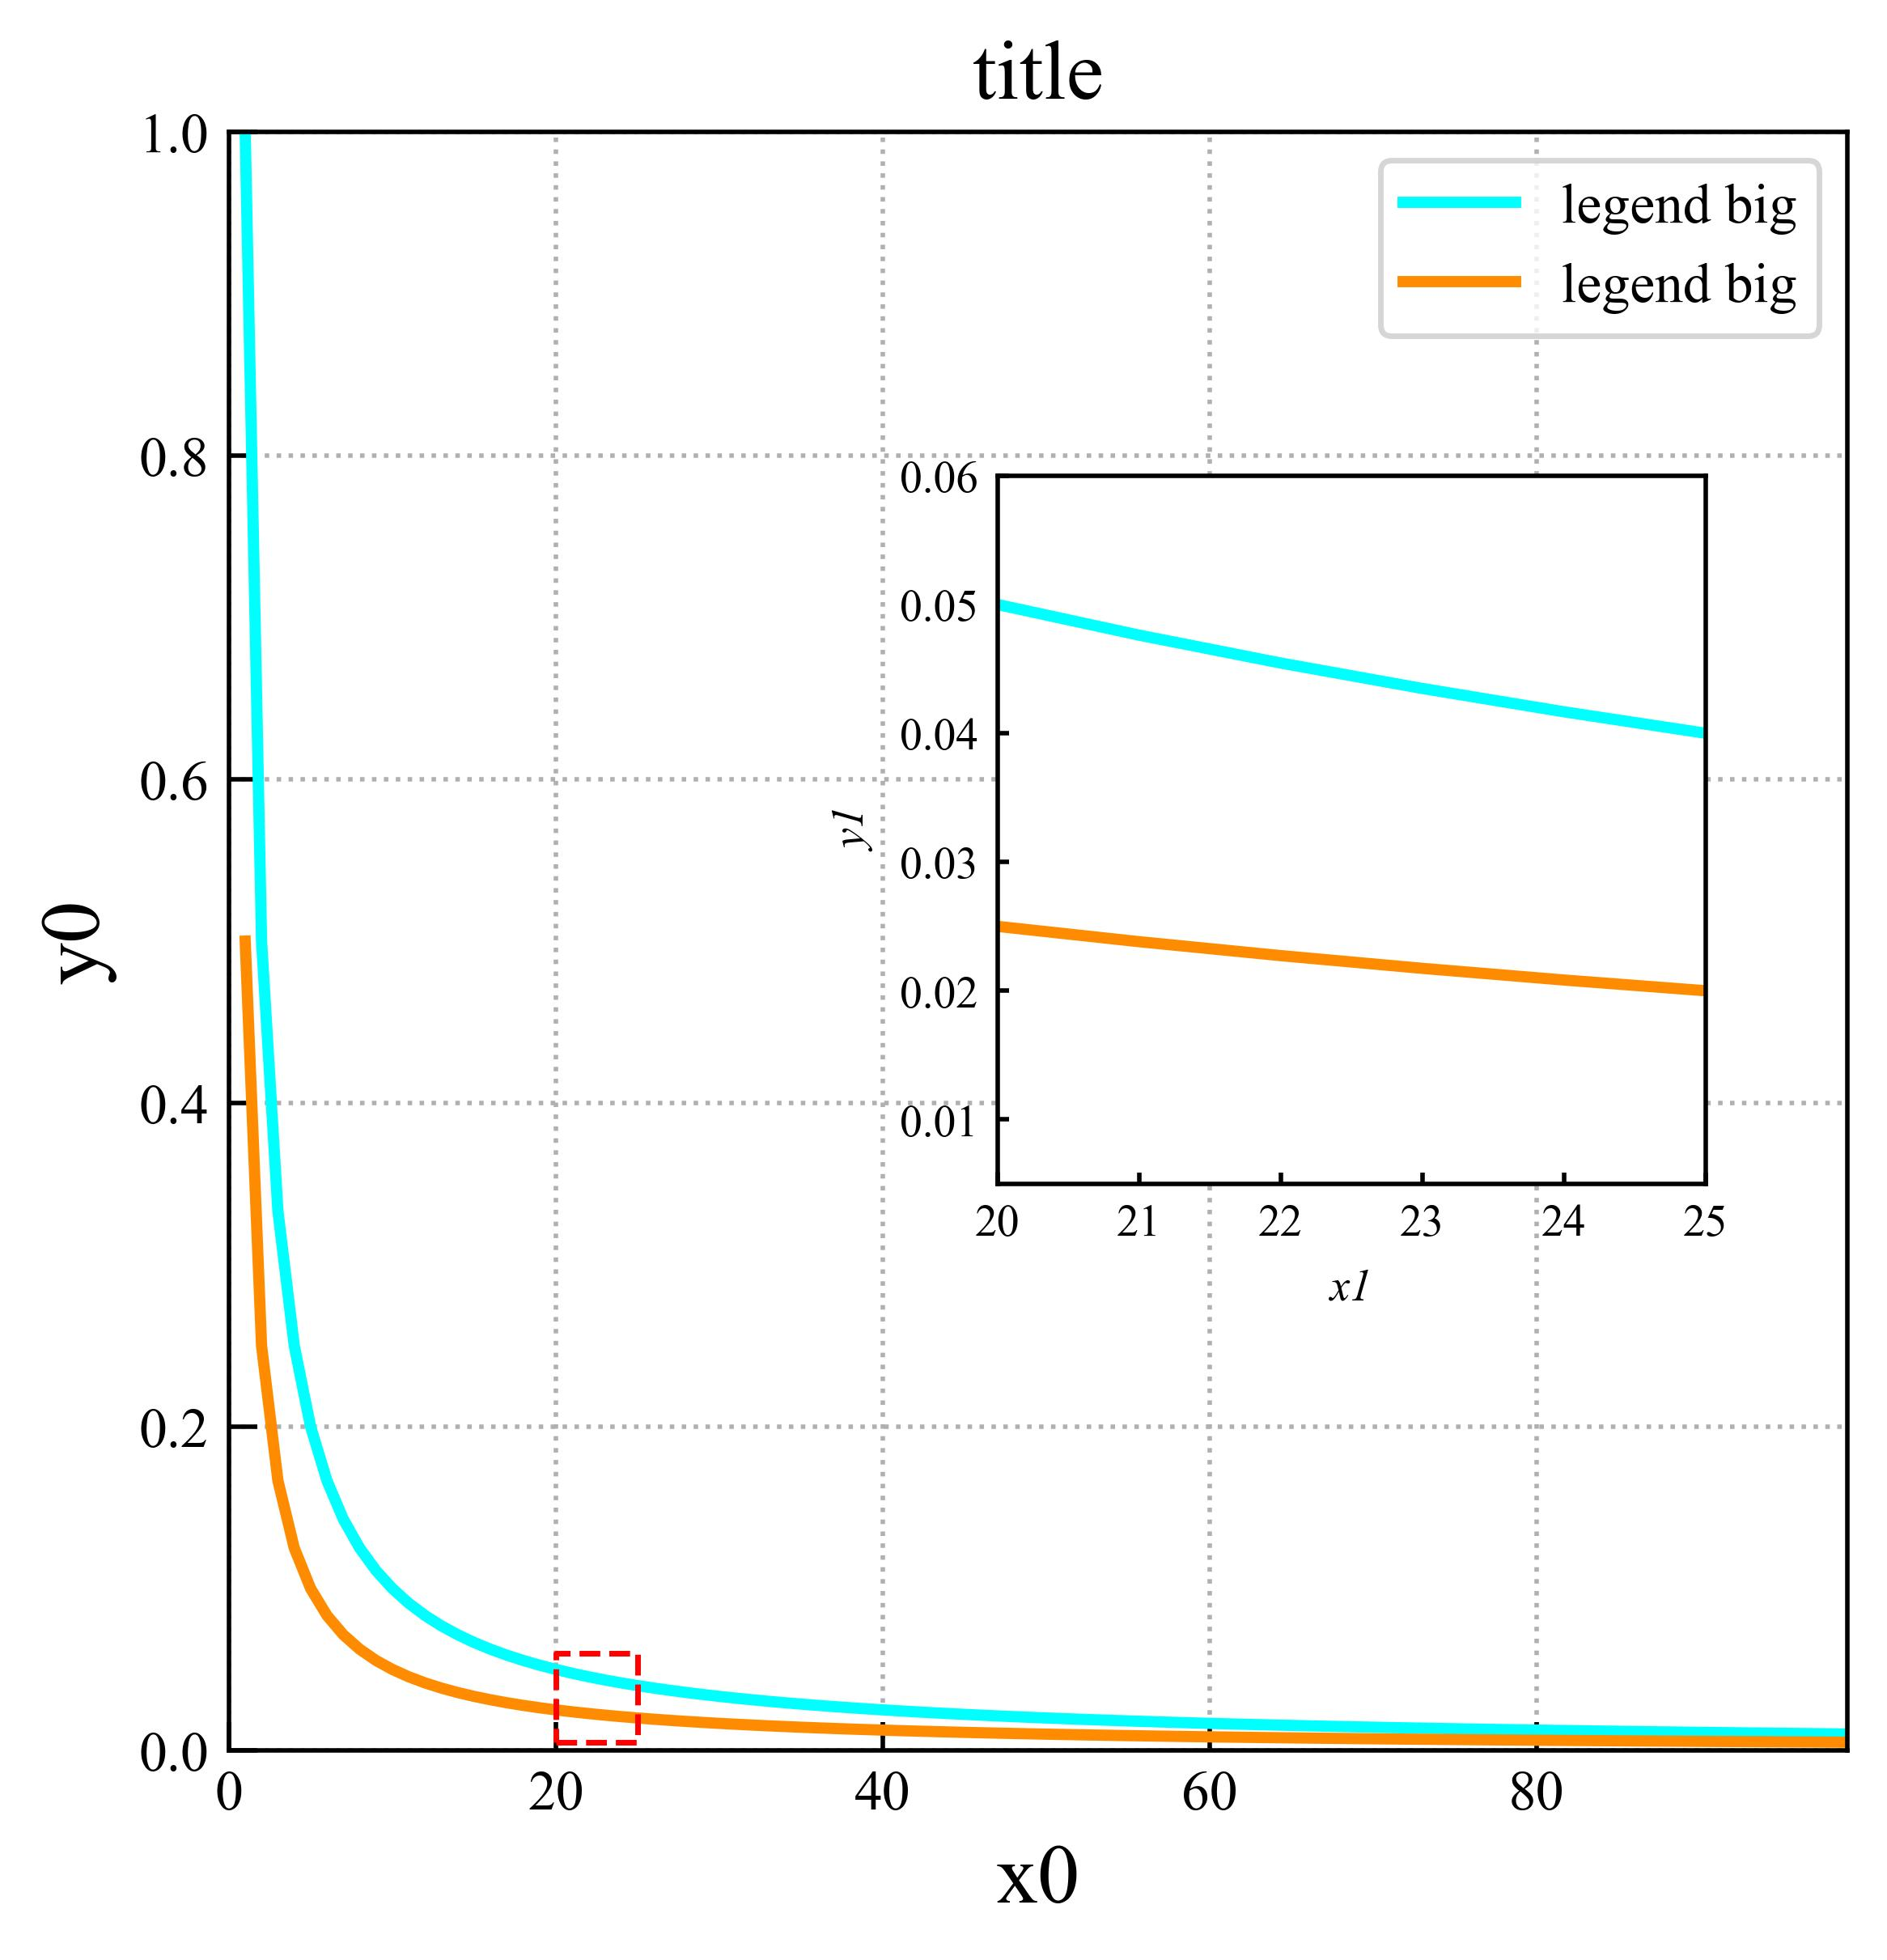
inset(嵌入图、插图),指的是在一张主图内部再放置一个较小的绘图区域。它常用于局部放大、展示数据细节、比较不同区域,或者在主图中补充直方图等辅助信息。
点我打开示例图片
区分三个概念:
- Figure:整张画布。
- 主 Axes:主要绘图区域。
- Inset Axes:嵌入在主图内部的小绘图区域。
Inset 并不是把一张已经生成的图片简单贴到主图上,而是创建一个独立的 Axes,因此它可以有自己的数据、坐标范围、刻度、标题和图例。
点我查看示例
import numpy as np
import matplotlib.pyplot as plt

x = np.linspace(0, 10, 300)
y = np.sin(x)

fig, ax = plt.subplots(figsize=(8, 5))

# 主图
ax.plot(x, y)
ax.set_title("Main Plot")

# 图内嵌图
axins = ax.inset_axes([0.55, 0.55, 0.35, 0.3])
axins.plot(x, y, color="red")

plt.show()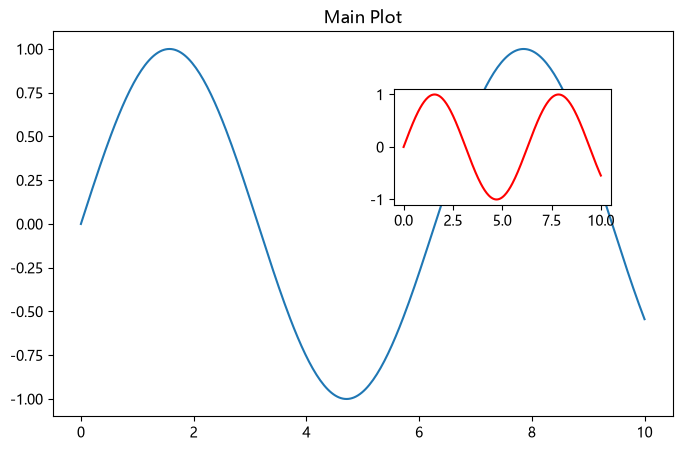
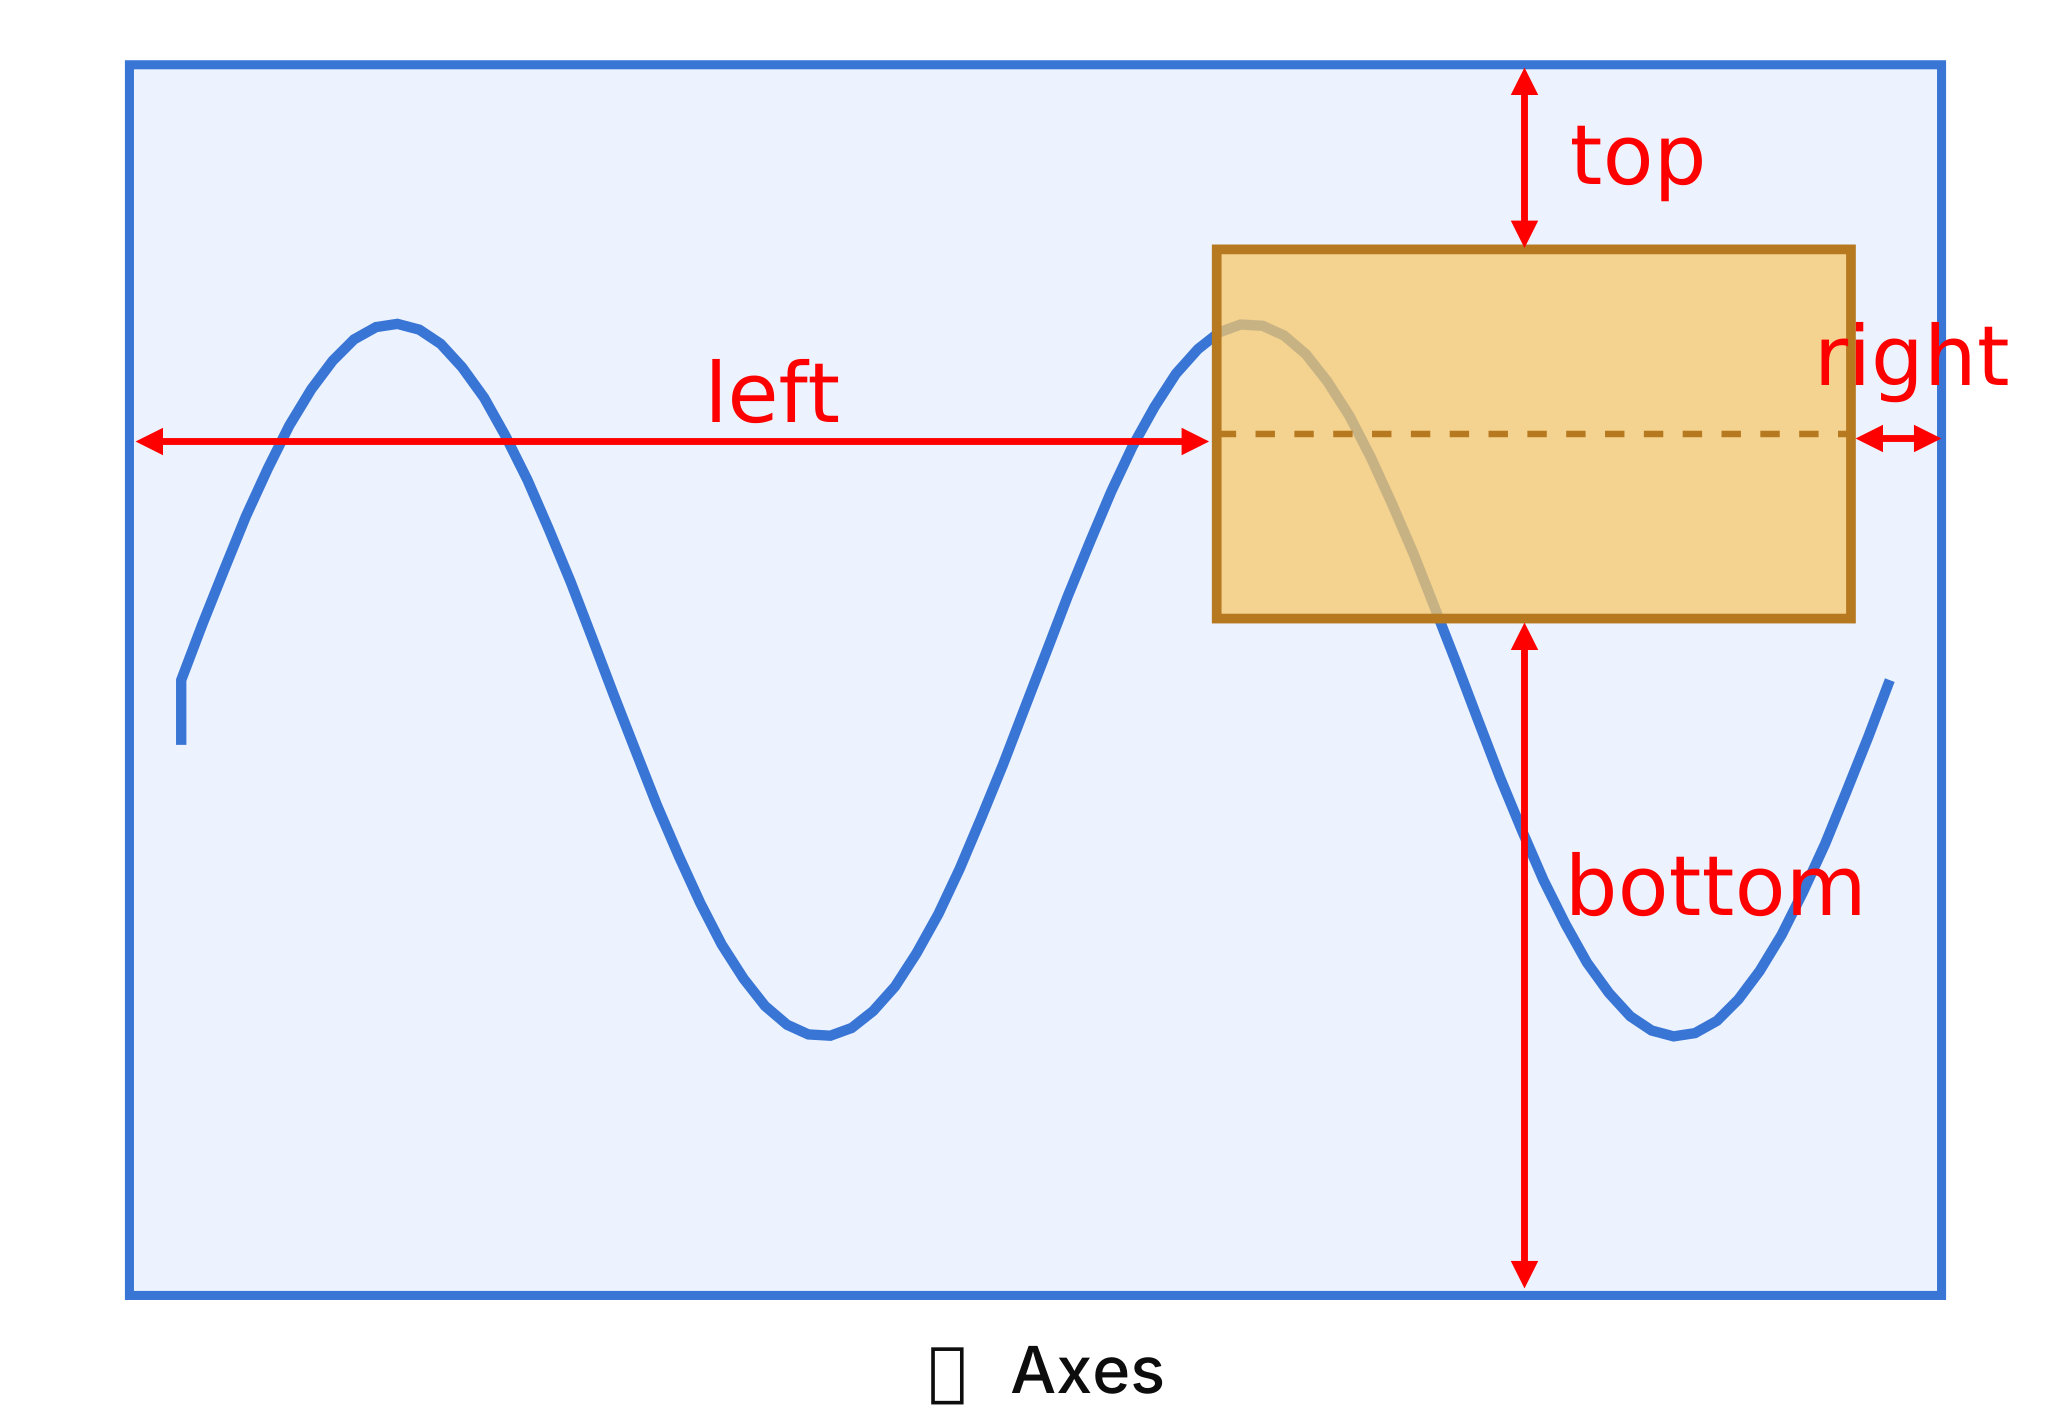
关键语句为 (值是相对于主 Axes 绘图区的比例,而不是整个 Figure 的比例):
axins = ax.inset_axes([left, bottom, width, height])这里的 ax.inset_axes() 与 fig.add_axes() 不同。前者通常相对于主 Axes 定位,后者默认相对于 Figure 定位。
除了 ax.inset_axes(),Matplotlib 还提供了:
from mpl_toolkits.axes_grid1.inset_locator import inset_axes这个函数可以创建相对于主 Axes 定位的嵌入图,并允许使用英寸、百分比等方式指定大小。
点我查看示例
import numpy as np
import matplotlib.pyplot as plt
from mpl_toolkits.axes_grid1.inset_locator import inset_axes

x = np.linspace(0, 10, 200)
y = np.sin(x)

fig, ax = plt.subplots(figsize=(8, 5))
ax.plot(x, y)

axins = inset_axes(
    ax,
    width="35%",
    height="35%",
    loc="upper right"
)

axins.plot(x, y, color="red")
axins.set_xlim(4, 5)
axins.set_ylim(-1, 0)

plt.show()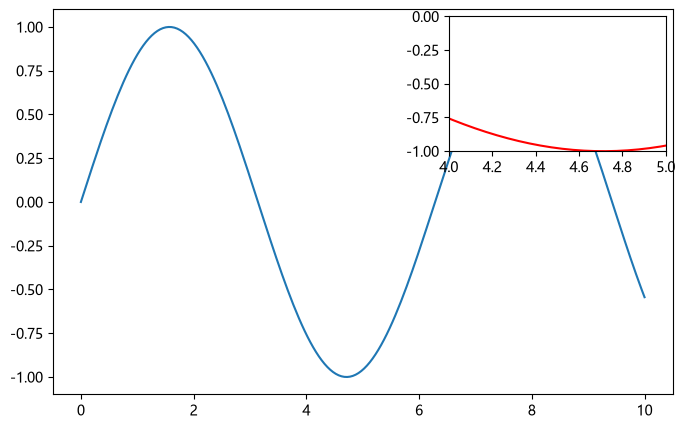
双 Y 轴 / 副坐标轴
双 Y 轴(双纵坐标轴)是指在同一张图中,使用两个不同的纵坐标轴展示两组数据。它特别适合比较量纲不同、数值范围差异较大,但横坐标相同的数据。 创建双 Y 轴最常用的方法是:
fig, ax1 = plt.subplots()
ax2 = ax1.twinx()
它会创建一个新的 Axes 对象 ax2,使它与 ax1 共享 X 轴,但拥有独立的 Y 轴。
查看示例
import numpy as np
import matplotlib.pyplot as plt

# 模拟数据
months = np.arange(1, 13)
sales = [20, 25, 28, 35, 40, 45, 50, 48, 42, 38, 30, 25]
temperature = [3, 5, 10, 16, 22, 27, 30, 29, 24, 17, 10, 5]

# 创建画布和主坐标轴
fig, ax1 = plt.subplots(figsize=(9, 5))

# 左侧 Y 轴:销售额
line1, = ax1.plot(
    months, sales,
    color="tab:blue", marker="o",
    label="Sales"
)
ax1.set_xlabel("Month")
ax1.set_ylabel("Sales (10,000 yuan)", color="tab:blue")
ax1.tick_params(axis="y", labelcolor="tab:blue")

# 创建副坐标轴,共享 X 轴
ax2 = ax1.twinx()

# 右侧 Y 轴:气温
line2, = ax2.plot(
    months, temperature,
    color="tab:red", marker="s",
    label="Temperature"
)
ax2.set_ylabel("Temperature (°C)", color="tab:red")
ax2.tick_params(axis="y", labelcolor="tab:red")

# 设置标题
ax1.set_title("Monthly Sales and Temperature")

# 合并两个坐标轴的图例
ax1.legend(
    [line1, line2],
    [line1.get_label(), line2.get_label()],
    loc="upper left"
)

fig.tight_layout()
plt.show()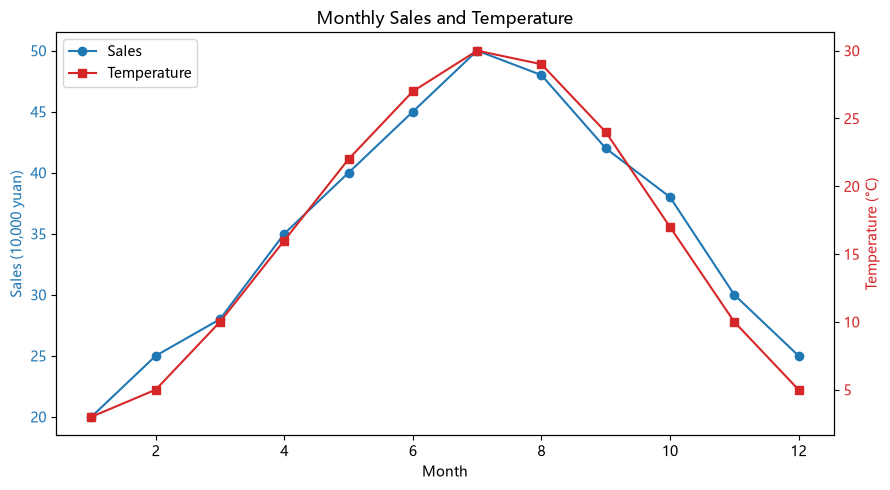
twinx() 返回的是另一个 Axes,而不是在原有 Axes 上简单增加一条右侧刻度。因此可以分别调用 ax1.plot() 和 ax2.plot(),也可以分别设置它们的 Y 轴范围。
还有一个与之对应的方法:twiny()。
| 方法 | 共享的轴 | 新增的轴 | 典型用途 |
|---|---|---|---|
ax.twinx() |
X 轴 | 右侧 Y 轴 | 两组数据共用横坐标 |
ax.twiny() |
Y 轴 | 顶部 X 轴 | 两组数据共用纵坐标 |
fig, ax1 = plt.subplots()
ax2 = ax1.twiny()
布局引擎
布局引擎主要解决一个问题:如何安排 Figure 中各个 Axes 的位置和大小,使标题、坐标轴标签、刻度、图例等元素尽可能不发生重叠或被裁切。
最常用的是:
layout="constrained":创建 Figure 时启用布局引擎。layout="tight":使用紧凑布局引擎。fig.tight_layout():执行一次紧凑布局调整。这是一个方法,不是布局引擎本身。 此外,layout=None表示默认的布局行为;
常规绘图与多子图
fig, axes = plt.subplots(2, 2, layout="constrained")一次性紧凑调整
fig, axes = plt.subplots(2, 2)
fig.tight_layout()
保存图片时裁切外围空白
fig.savefig("figure.png", bbox_inches="tight", dpi=300)如果自动布局无法达到想要的效果,fig.subplots_adjust() 可以手动控制子图边距和间距可以直接控制 Figure 的边距和子图间距。
fig.subplots_adjust(
    left=0.12,
    right=0.95,
    bottom=0.12,
    top=0.90,
    wspace=0.30,
    hspace=0.35
)这里的数值表示绘图区域边界在 Figure 中的相对位置。例如 left=0.1 表示绘图区域左边界位于画布宽度的 10% 处。