文章Matplotlib第 34 章
表格与偏移框
Matplotlib · 第 34 / 43 章
表格 table()
Axes.table() 在坐标轴里塞一张真表格(由一堆 Cell 拼成,每个 Cell 是一个带文字的矩形)。它默认铺满整幅、loc='bottom',所以实际用起来几乎一定要配 bbox 或先 ax.axis('off')。
Axes.table(
    cellText=None,        # 二维列表:行 × 列
    cellColours=None,     # 与 cellText 同形的颜色二维列表
    cellLoc="right",      # 数据格的对齐;★ 默认右对齐
    colWidths=None,       # 每列宽度,单位是**轴宽的倍数**,总和建议 ≈1
    rowLabels=None,       # 行头(放最左一列)
    rowColours=None,      # 行头底色列表
    rowLoc="left",        # 行头对齐
    colLabels=None,       # 列头(放最上一行)
    colColours=None,      # 列头底色列表
    colLoc="center",      # 列头对齐
    loc="bottom",         # 整表相对 axes 的位置
    bbox=None,            # 4 元组或 Bbox,给定位;给了 loc 就失效
    edges="closed",       # 'closed' / 'open' / 'horizontal' / 'vertical'
    **kwargs
)| 参数 | 一句话 | 默认值的影响 |
|---|---|---|
cellText |
表格正文 | 必填(或用 cellColours 造空表) |
cellLoc / colLoc / rowLoc |
三处对齐 | right / center / left |
colWidths |
列宽(轴宽倍数) | None → 均分,表铺满整个 axes |
colLabels / rowLabels |
表头 | 不给就没有表头行/列 |
colColours / rowColours |
表头变色 | None 全白 |
loc / bbox |
放哪儿 | 'bottom' 铺在下沿;给 bbox 覆盖它 |
edges |
画哪几条边 | 'closed' 四边全画 |
最小示例
import matplotlib.pyplot as plt

fig, ax = plt.subplots(figsize=(5, 2))
ax.axis('off')
tbl = ax.table(cellText=[['2025', '182', '+8.2%'],
                         ['2026', '205', '+12.6%']],
               colLabels=['年份', '销售额', '同比'],
               colWidths=[.3, .3, .4], loc='center', cellLoc='center')
tbl.auto_set_font_size(False)
tbl.set_fontsize(10)
tbl.scale(1, 1.8)
plt.show()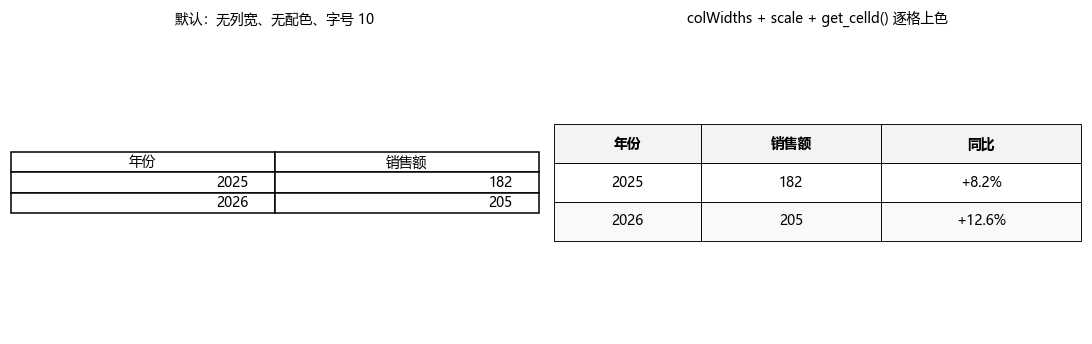
colWidths 与 scale:调大小只有这两条路
tbl = ax.table(cellText=[['a', 'b']], colWidths=[.4, .6])   # 列宽按轴宽比例
tbl.scale(1.0, 2.0)      # 横向 1 倍、纵向 2 倍
colWidths 的数值是轴宽的倍数,全列加起来建议接近 1(超过会伸出轴外)。scale(sx, sy) 才是整体缩放——注意它缩放的是格子的相对尺寸,不改变表的锚点,所以放大后表会从原锚点往外长。
行高没有 rowHeights 参数,只能靠 scale 的第二参数 sy,或者逐个 cell.set_height()。
get_celld():索引规则会随表头变化
这是最容易写错的地方。get_celld() 返回 {(row, col): Cell},而行号是否从 0 开始取决于给没给 colLabels:
import matplotlib.pyplot as plt

fig, ax = plt.subplots()
t1 = ax.table(cellText=[['a', 'b'], ['c', 'd']])
print(sorted(t1.get_celld()))
# 输出: [(0, 0), (0, 1), (1, 0), (1, 1)]

t2 = ax.table(cellText=[['a', 'b'], ['c', 'd']], colLabels=['X', 'Y'],
              rowLabels=['r1', 'r2'])
print(sorted(t2.get_celld()))
# 输出: [(0, 0), (0, 1), (1, -1), (1, 0), (1, 1), (2, -1), (2, 0), (2, 1)]

print(repr(t2.get_celld()[(0, 0)].get_text().get_text()))
# 输出: 'X'规则:
| 给了什么 | (0, 0) 是 |
数据从哪格起 | 行头在哪 |
|---|---|---|---|
只有 cellText |
第一格数据 | (0, 0) |
— |
+ colLabels |
列表头第一格 | (1, 0) |
— |
+ colLabels 和 rowLabels |
列表头第一格 | (1, 0) |
col = -1 那一列 |
所以「给第一行数据上色」这种需求,代码必须先判断有没有表头:
tbl = ax.table(cellText=[['a', 'b'], ['c', 'd']], colLabels=['X', 'Y'])
for (r, c), cell in tbl.get_celld().items():
    if r == 0:
        cell.set_facecolor('#f1f3f5')      # 有 colLabels 时 r=0 是表头
    elif r % 2 == 1:
cell.set_facecolor('#f8f9fa') # 斑马纹逐格改样式:get_celld() 是唯一入口
Table 本身只有 scale / set_fontsize / auto_set_font_size / auto_set_column_width 四个整体方法,所有细粒度样式(底色、边框、加粗、文字颜色)都得逐格改:
import matplotlib.pyplot as plt

fig, ax = plt.subplots(figsize=(5, 2))
ax.axis('off')
tbl = ax.table(cellText=[['2025', '182'], ['2026', '205']],
               colLabels=['年份', '销售额'], loc='center')

for (r, c), cell in tbl.get_celld().items():
    cell.set_linewidth(.6)
    if r == 0:
        cell.set_facecolor('#f1f3f5')
        cell.set_text_props(weight='bold', color='#343a40')
    elif c == 1:
        cell.set_text_props(ha='right')      # 数值列右对齐
plt.show()Cell 继承自 Rectangle,所以 set_facecolor / set_edgecolor / set_linewidth / set_height 全可用;文字是 cell.get_text(),或直接 cell.set_text_props(**kwargs)。
edges:只画需要的边
import matplotlib.pyplot as plt

fig, ax = plt.subplots()
for i, e in enumerate(['closed', 'open', 'horizontal', 'vertical']):
    t = ax.table(cellText=[['a']], edges=e)
    print(e, repr(t.get_celld()[(0, 0)].visible_edges))
# 输出: closed 'BRTL'
# 输出: open ''
# 输出: horizontal 'BT'
# 输出: vertical 'RL'visible_edges 是「上下左右各画不画」的字符串,取值来自 BRTL(Bottom / Right / Top / Left)。三线表就靠这个做:整体用 edges='open',再逐格给表头上边、表头下边加线。
返回对象
import matplotlib.pyplot as plt

fig, ax = plt.subplots()
tbl = ax.table(cellText=[['a', 'b'], ['c', 'd']])
print(type(tbl).__name__)
# 输出: Table

print(type(tbl.get_celld()[(0, 0)]).__name__)
# 输出: CellTable 是 Artist 的子类,get_celld() 返回 {(row, col): Cell} 的字典。整体可调的只有这几个:
import matplotlib.pyplot as plt

fig, ax = plt.subplots()
tbl = ax.table(cellText=[['2025', '182'], ['2026', '205']], colLabels=['年份', '销售额'])
print([n for n in dir(tbl) if n in ('scale', 'set_fontsize', 'auto_set_font_size',
                                    'auto_set_column_width', 'get_celld')])
# 输出: ['auto_set_column_width', 'auto_set_font_size', 'get_celld', 'scale', 'set_fontsize']auto_set_font_size(True)(默认)会让字号随格子大小自适应——这就是为什么缩放后字号会莫名变大变小。想要固定字号必须先 auto_set_font_size(False),再 set_fontsize()。
注意事项
loc='bottom'是默认值,表会铺在轴下沿并盖住坐标轴;不用bbox就基本一定要先ax.axis('off')。get_celld()的行号会因colLabels存在而整体下移 1,(0, 0)在有无表头时指的不是同一格。rowLabels存在时行头在col = -1,不是col = 0——遍历时别把行头当数据。- 没有
rowHeights参数;改行高只能scale(1, sy)或逐格set_height。 auto_set_font_size默认开启,会覆盖你设的fontsize;要固定字号先关掉它。colWidths是轴宽倍数,加起来超过 1 会伸出轴外,且不会自动换行。Table不参与tight_layout/constrained_layout,位置全靠bbox或loc手动调。
综合示例:三线表 / 斑马纹表 / 带行头的表
import matplotlib.pyplot as plt

fig, axes = plt.subplots(1, 3, figsize=(13, 3))

# ① 三线表:只留顶线、表头下线和底线
ax = axes[0]
ax.axis('off')
tbl = ax.table(cellText=[['2024', '165', '—'], ['2025', '182', '+10.3%'],
                         ['2026', '205', '+12.6%']],
               colLabels=['年份', '销售额', '同比'],
               colWidths=[.3, .34, .36], loc='center', cellLoc='center',
               edges='open')
for (r, c), cell in tbl.get_celld().items():
    cell.set_linewidth(0)
tbl.auto_set_font_size(False)
tbl.set_fontsize(9)
tbl.scale(1, 1.9)
nrow = len(tbl.get_celld()) // 3
for (r, c), cell in tbl.get_celld().items():
    if r == 0:
        cell.visible_edges = 'BT'
        cell.set_linewidth(1.2)
    if r == nrow - 1:
        cell.visible_edges = 'B'
        cell.set_linewidth(1.2)
ax.set_title('三线表(edges + visible_edges)', fontsize=9)

# ② 斑马纹 + 数值右对齐
ax = axes[1]
ax.axis('off')
tbl = ax.table(cellText=[['华东', '182', '+8.2%'], ['华南', '145', '+3.1%'],
                         ['华北', '203', '+11.4%']],
               colLabels=['区域', '销售额', '同比'],
               colWidths=[.28, .34, .38], loc='center')
tbl.auto_set_font_size(False)
tbl.set_fontsize(9)
tbl.scale(1, 1.9)
for (r, c), cell in tbl.get_celld().items():
    cell.set_linewidth(.5)
    if r == 0:
        cell.set_facecolor('#343a40')
        cell.set_text_props(color='white', weight='bold')
    else:
        cell.set_facecolor('#ffffff' if r % 2 else '#f1f3f5')
        if c > 0:
            cell.set_text_props(ha='right')
ax.set_title('斑马纹 + 数值右对齐', fontsize=9)

# ③ 带行头(col = -1)
ax = axes[2]
ax.axis('off')
tbl = ax.table(cellText=[['182', '+8.2%'], ['145', '+3.1%'], ['203', '+11.4%']],
               rowLabels=['华东', '华南', '华北'],
               colLabels=['销售额', '同比'],
               colWidths=[.5, .5], loc='center')
tbl.auto_set_font_size(False)
tbl.set_fontsize(9)
tbl.scale(1, 1.9)
for (r, c), cell in tbl.get_celld().items():
    cell.set_linewidth(.5)
    if c == -1:
        cell.set_facecolor('#f1f3f5')     # 行头
        cell.set_text_props(weight='bold')
    elif r == 0:
        cell.set_facecolor('#f1f3f5')
ax.set_title('带行头(col = -1)', fontsize=9)

plt.tight_layout()
plt.show()第 ③ 格的关键是 c == -1 那一列才是行头,(0, 0) 依然是列表头第一格——两个偏移方向不同,只能分别判断。
偏移框 AnnotationBbox
annotate() 只能放一段文字。要放「多段文字拼接」「小图标」「任意 artist」,就用 AnnotationBbox——它把一个盒子钉在数据点旁,偏移量用点计算,不随数据缩放变。
AnnotationBbox(
    offsetbox,                # ★ 被钉的盒子:TextArea / HPacker / VPacker / DrawingArea / OffsetImage
    xy,                       # ★ 钉在哪个点
    xybox=None,               # 盒子自己放在哪;不给就等于 xy
    xycoords="data",          # xy 的坐标系
    boxcoords=None,           # xybox 的坐标系;★ None → 跟随 xycoords
    *,
    frameon=True,             # 画不画外框
    pad=0.4,                  # 框内边距(字号倍数)
    annotation_clip=None,      # 锚点出界时是否隐藏
    box_alignment=(0.5, 0.5),  # 盒子的哪个点对齐到 xybox
    bboxprops=None,           # 外框样式,写法同 text 的 bbox
    arrowprops=None,          # 箭头,写法同 annotate
    fontsize=None,
    **kwargs
)| 参数 | 一句话 | 默认值的影响 |
|---|---|---|
offsetbox |
盒子里装啥 | 必填;TextArea 只吃 textprops |
xy / xybox |
钉的点 / 盒子放的点 | xybox=None → 盒子压在点上 |
xycoords / boxcoords |
两套坐标系 | boxcoords=None → 跟随 xycoords('data') |
box_alignment |
盒子哪个点对齐 xybox |
(0.5, 0.5) 居中 |
frameon / pad / bboxprops |
外框 | 默认有框、pad=0.4 |
arrowprops |
从盒子指向 xy 的箭头 |
None |
最小示例
import matplotlib.pyplot as plt
from matplotlib.offsetbox import AnnotationBbox, TextArea

fig, ax = plt.subplots()
x = [0, 1, 2, 3, 4]
y = [1, 3, 2, 5, 4]
ax.plot(x, y, 'o-', color='#4C72B0')

for xi, yi, lab in zip(x, y, ['甲', '乙', '丙', '丁', '戊']):
    ab = AnnotationBbox(TextArea(lab, textprops=dict(color='#1c7ed6', size=9)),
                        (xi, yi), xybox=(10, 10), xycoords='data',
                        boxcoords='offset points', frameon=False, pad=0)
    ax.add_artist(ab)          # ★ 必须手动挂上去
plt.show()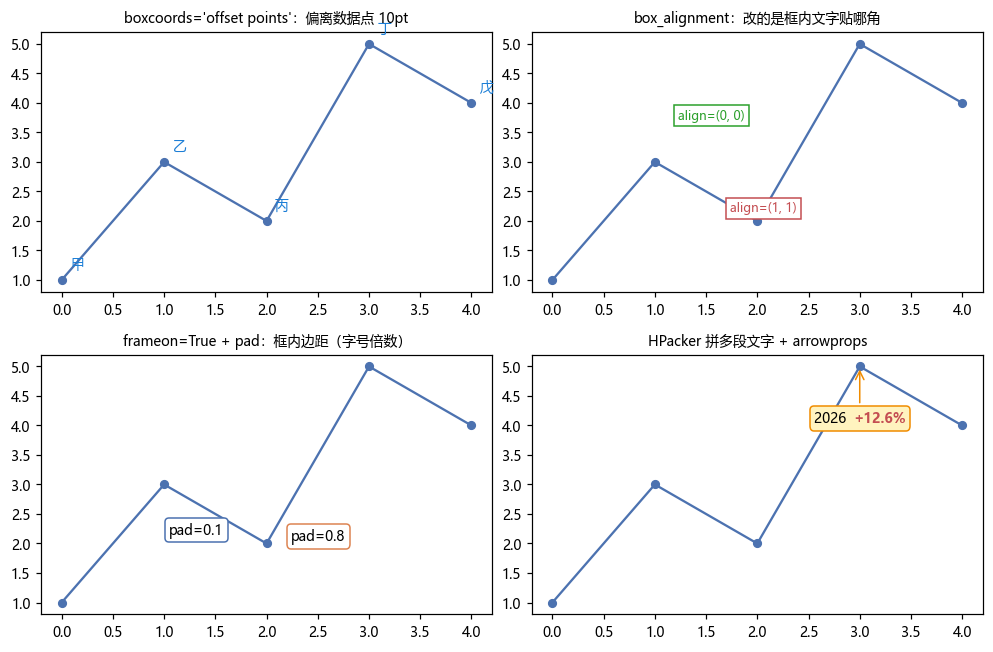
offsetbox:盒子里能装什么
| 类 | 干什么 | 关键参数 |
|---|---|---|
TextArea |
一段文字 | textprops=dict(...) |
HPacker |
横向拼多个盒子 | children / sep / pad / align |
VPacker |
纵向拼多个盒子 | 同上 |
DrawingArea |
一块可画图的画布 | width / height / clip |
OffsetImage |
一张图片 | arr / zoom / cmap |
TextArea 没有 color= 这类关键字,样式必须塞进 textprops:
from matplotlib.offsetbox import TextArea

try:
    TextArea('x', color='red')
except TypeError as e:
    print(e)
# 输出: TextArea.__init__() got an unexpected keyword argument 'color'

t = TextArea('x', textprops=dict(color='red', size=10, weight='bold')) # ✓HPacker 用来做「年份 + 数值」这种混排,两段可以各设各的颜色字重:
from matplotlib.offsetbox import HPacker, TextArea

box = HPacker(children=[TextArea('2026 ', textprops=dict(size=9)),
                        TextArea('+12.6%', textprops=dict(size=9, weight='bold',
                                                          color='#C44E52'))],
              align='center', pad=0, sep=2)
xybox + boxcoords:不写 boxcoords 就白折腾
这是最容易踩的一处。boxcoords 默认 None,意思是跟随 xycoords,而 xycoords 默认 'data':
import matplotlib.pyplot as plt
from matplotlib.offsetbox import AnnotationBbox, TextArea

fig, ax = plt.subplots()
ab = AnnotationBbox(TextArea('甲'), (1, 2))
print(ab.xycoords, ab.boxcoords, ab.xybox)
# 输出: data data (1, 2)所以 xybox=(10, 10) 会被当成「数据坐标 (10, 10)」——图上一共只有 0~4,盒子直接飞出画布。想要「相对数据点偏移 10 点」必须显式写:
import matplotlib.pyplot as plt
from matplotlib.offsetbox import AnnotationBbox, TextArea

fig, ax = plt.subplots()
ab = AnnotationBbox(TextArea('甲'), (1, 2),
                    xybox=(10, 10), boxcoords='offset points')
ax.add_artist(ab)
plt.show()'offset points' 是这里唯一实用的选择,另外还能用 'offset pixels'(受 DPI 影响,跨屏不稳定)。
box_alignment:盒子内部哪个角贴 xybox
import matplotlib.pyplot as plt
from matplotlib.offsetbox import AnnotationBbox, TextArea

fig, ax = plt.subplots()
for al, off in [((0, 0), (-52, 26)), ((1, 1), (26, -26))]:
    ab = AnnotationBbox(TextArea('x'), (2, 3), xybox=off, xycoords='data',
                        boxcoords='offset points', box_alignment=al)
    ax.add_artist(ab)
plt.show()(0, 0) = 盒子左下角落在 xybox、(1, 1) = 右上角、(0.5, 0.5)(默认)= 中心。它改的是盒子内部的对齐点,不是偏移量——偏移只由 xybox 决定。
frameon / pad / bboxprops:外框三层
import matplotlib.pyplot as plt
from matplotlib.offsetbox import AnnotationBbox, TextArea

fig, ax = plt.subplots()
ax.add_artist(AnnotationBbox(
    TextArea('无框'), (2, 3), xybox=(0, 20),
    boxcoords='offset points', frameon=False))

ax.add_artist(AnnotationBbox(
    TextArea('有框'), (2, 3), xybox=(0, -20),
    boxcoords='offset points', frameon=True, pad=0.6,
    bboxprops=dict(boxstyle='round', fc='#fff3bf', ec='#f08c00')))
plt.show()frameon=False 等价于不画 patch;pad 是框内边距(字号倍数);bboxprops 的写法和 text 的 bbox 完全一致,boxstyle / fc / ec / lw 都能用。
arrowprops:从盒子指向锚点
import matplotlib.pyplot as plt
from matplotlib.offsetbox import AnnotationBbox, TextArea

fig, ax = plt.subplots()
ab = AnnotationBbox(TextArea('2026 +12.6%'), (3, 5), xybox=(0, -34),
                    boxcoords='offset points', frameon=True, pad=.4,
                    bboxprops=dict(boxstyle='round', fc='#fff3bf', ec='#f08c00'),
                    arrowprops=dict(arrowstyle='->', color='#f08c00'))
ax.add_artist(ab)
plt.show()arrowprops 的键和 annotate 里那张表一模一样(arrowstyle / connectionstyle / shrinkA / shrinkB / color / lw)。方向也一致:箭头从「盒子所在位置(xybox)」指向「锚点(xy)」,也就是箭头尖永远落在数据点上,盒子在哪儿它就从哪儿出发。
返回对象
import matplotlib.pyplot as plt
from matplotlib.offsetbox import AnnotationBbox, TextArea

fig, ax = plt.subplots()
ab = AnnotationBbox(TextArea('甲'), (1, 2), xybox=(10, 10),
                    boxcoords='offset points')
print(type(ab).__name__)
# 输出: AnnotationBbox

print(ab in ax.get_children())
# 输出: False

ax.add_artist(ab)
print(ab in ax.get_children())
# 输出: TrueAnnotationBbox 构造完不会自动上图——annotate() 会自己挂,AnnotationBbox 不会,必须 ax.add_artist(ab)。这是「我明明创建了却什么都看不到」的第一号原因。
它是 Artist 子类,所以 remove() / set_visible() / set_zorder() 都能用:
import matplotlib.pyplot as plt
from matplotlib.offsetbox import AnnotationBbox, TextArea

fig, ax = plt.subplots()
ab = AnnotationBbox(TextArea('甲'), (1, 2))
ax.add_artist(ab)
ab.set_zorder(10)
print(ab.get_zorder())
# 输出: 10内部读法:ab.offsetbox(那个盒子)、ab.patch(外框 FancyBboxPatch)、ab.xybox(落点)。想改文字得往下挖到 ab.offsetbox 里的 TextArea,不能直接 ab.set_text。
注意事项
- 必须
ax.add_artist(ab),构造完不会自动进图。实测ab in ax.get_children()构造后是False。 TextArea没有color=/fontsize=,样式只能走textprops=dict(...),传错直接TypeError。boxcoords不写就跟随xycoords('data'),xybox=(10, 10)会变成数据坐标偏移、飞出画布。box_alignment改的是盒子内部对齐点,不是偏移量;偏移只由xybox决定。pad是字号倍数,pad=0会让框贴住文字墨迹。bboxprops和text的bbox写法完全一致,但必须传字典,传字符串同样报AttributeError。- 图例、
tight_layout都不认AnnotationBbox的尺寸,可能压到别的元素上;固定位置建议用transform=ax.transAxes+xybox。 - 和
annotate的分工:一段文字 + 箭头用annotate;多段拼接、图片、自定义画布用AnnotationBbox。
综合示例:数据点标签 / 多段混排 / 图片标注
import matplotlib.pyplot as plt
import numpy as np
from matplotlib.offsetbox import AnnotationBbox, TextArea, HPacker, VPacker

fig, axes = plt.subplots(1, 3, figsize=(13, 3.8))
x = np.arange(5)

# ① 每个点旁挂一个偏移标签
ax = axes[0]
y = np.array([1, 3, 2, 5, 4])
ax.plot(x, y, 'o-', color='#4C72B0')
for xi, yi, lab in zip(x, y, list('甲乙丙丁戊')):
    ax.add_artist(AnnotationBbox(
        TextArea(lab, textprops=dict(color='#1c7ed6', size=9)),
        (xi, yi), xybox=(0, 12), xycoords='data',
        boxcoords='offset points', frameon=False, pad=0))
ax.set_title('offset points 标签', fontsize=9)

# ② 两段文字混排(不同颜色/字重)
ax = axes[1]
ax.bar(['A', 'B'], [18, 24], color='#4C72B0')
for i, (v, d) in enumerate(zip([18, 24], ['+8.2%', '+12.6%'])):
    box = HPacker(children=[TextArea(f'{v} ', textprops=dict(size=9)),
                            TextArea(d, textprops=dict(size=9, weight='bold',
                                                       color='#C44E52'))],
                  align='center', pad=0, sep=1)
    ax.add_artist(AnnotationBbox(
        box, (i, v), xybox=(0, 14), xycoords='data',
        boxcoords='offset points', frameon=True, pad=.35,
        bboxprops=dict(boxstyle='round', fc='white', ec='0.75')))
ax.set_ylim(0, 30)
ax.set_title('HPacker 混排', fontsize=9)

# ③ 两行文字竖排 + 箭头指向数据点
ax = axes[2]
ax.plot(x, x ** 1.6, 'o-', color='#4C72B0')
box = VPacker(children=[TextArea('峰值区', textprops=dict(size=9, weight='bold')),
                        TextArea('x=4, y≈8.6', textprops=dict(size=8, color='0.4'))],
              align='center', pad=0, sep=1)
ax.add_artist(AnnotationBbox(
    box, (4, 4 ** 1.6), xybox=(-30, 26), xycoords='data',
    boxcoords='offset points', frameon=True, pad=.4,
    bboxprops=dict(boxstyle='round,pad=0.4', fc='#fff3bf', ec='#f08c00'),
    arrowprops=dict(arrowstyle='->', color='#f08c00', shrinkB=4)))
ax.set_title('VPacker + 箭头', fontsize=9)

plt.tight_layout()
plt.show()第 ③ 格把 VPacker(竖排两块文字)和 arrowprops 一起用了:盒子在左上方,箭头从盒子底边指向数据点。shrinkB=4 让箭头尖和数据点之间留 4pt,避免压住 marker。