目录14
文章Matplotlib第 40 章
常见陷阱与坐标轴调整
Matplotlib · 第 40 / 43 章
3D 里会静默画错的东西
Axes3D 继承了整个二维 Axes,所以 2D 方法几乎都存在。存在不等于画对——下面这些全部不报错、不警告,只是结果不对。
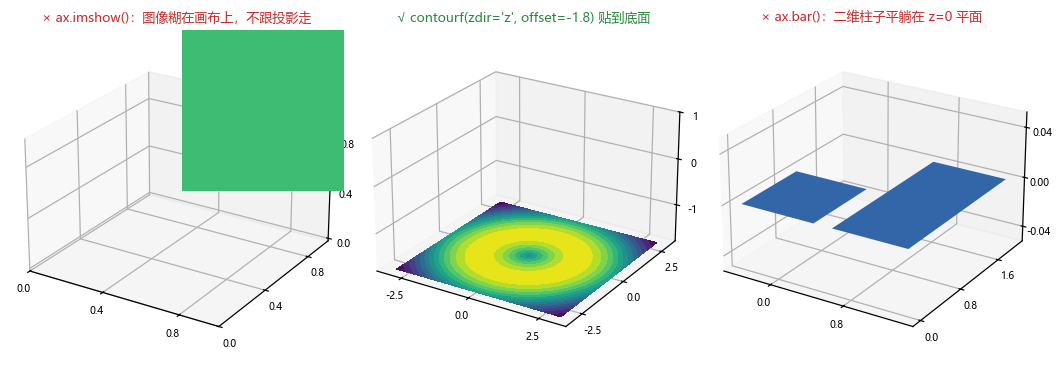
imshow / pcolormesh:糊在画布上
import matplotlib.pyplot as plt
import numpy as np

img = np.random.default_rng(0).random((6, 6))
fig = plt.figure(figsize=(3.4, 3.0))
ax = fig.add_subplot(projection='3d')

im = ax.imshow(img, extent=(0, 1, 0, 1), cmap='viridis')
print(type(im).__name__, im.get_extent(), hasattr(im, 'set_z'))
# 输出: AxesImage [0.0, 1.0, 0.0, 1.0] False
print(len(ax.images))
# 输出: 1
plt.close(fig)返回值是 AxesImage、extent 原样接受、没有 set_z——它被当成二维图像贴在 Axes 的屏幕坐标系上,完全不管 3D 投影。想“在底面铺一张图”,用 contourf(..., zdir='z', offset=...):
import matplotlib.pyplot as plt
import numpy as np

x = np.linspace(-3, 3, 40)
X, Y = np.meshgrid(x, x)
Z = np.sin(np.hypot(X, Y))

fig = plt.figure(figsize=(3.6, 3.2))
ax = fig.add_subplot(projection='3d')
cf = ax.contourf(X, Y, Z, zdir='z', offset=-1.8, levels=14, cmap='viridis')
ax.set_zlim(-1.8, 1.0)
print(type(cf).__name__, len(cf.levels))
# 输出: QuadContourSet3D 14
plt.close(fig)bar / hist / step:平躺在 z=0
import matplotlib.pyplot as plt
import numpy as np

fig = plt.figure(figsize=(3.4, 3.0))
ax = fig.add_subplot(projection='3d')
ax.bar([0, 1], [1, 2], color='#3266a8')
print(type(ax.patches[0]).__name__, len(ax.patches))
# 输出: Patch3D 2
plt.close(fig)返回的确实是 Patch3D(说明它走了 3D 的代码路径),但画出来是两张平铺在 z=0 平面上的方块——因为没有柱高,bar 的 height 被当成 y 方向的长度。三维柱必须用 bar3d。
hist / step 同理:它们往 3D 轴上画的是二维图形,看起来“能用”,但你没法从图里读高度。
errorbar / fill_between / stem:签名变了
这三个方法在 3D 上换了一套参数,按 2D 习惯调用直接报错:
import matplotlib.pyplot as plt

fig = plt.figure()
ax = fig.add_subplot(projection='3d')

try:
    ax.errorbar([0, 1], [0, 1], [0.1, 0.1])      # 2D 写法:x, y, yerr
except IndexError as e:
    print('IndexError', str(e)[:52])
# 输出: IndexError too many indices for array: array is 1-dim

try:
    ax.fill_between([0, 1], [0, 1])              # 2D 写法:x, y1(, y2)
except TypeError as e:
    print('TypeError', str(e)[:52])
# 输出: TypeError Axes3D.fill_between() missing 4 required posit
plt.close(fig)3D 版的签名:
import inspect
import matplotlib.pyplot as plt

fig = plt.figure()
ax = fig.add_subplot(projection='3d')
print('fill_between', str(inspect.signature(ax.fill_between))[:62])
# 输出: fill_between (x1, y1, z1, x2, y2, z2, *, where=None, mode='aut
print('errorbar', str(inspect.signature(ax.errorbar))[:40])
# 输出: errorbar (x, y, z, zerr=None, yerr=None, x
plt.close(fig)fill_between 要两组坐标(两条曲线各三点),errorbar 把第三维塞进了位置参数、误差项变成 zerr / yerr / xerr。照 2D 文档抄一定报错。
text vs text2D
import matplotlib.pyplot as plt

fig = plt.figure()
ax = fig.add_subplot(projection='3d')

t3 = ax.text(0, 0, 0, '立体里的文字')          # 跟着投影走,会被遮挡
t2 = ax.text2D(0.02, 0.95, '(a)', transform=ax.transAxes)   # 钉在画布左上角
print(type(t3).__name__, type(t2).__name__)
# 输出: Text3D Text
plt.close(fig)text 的坐标是数据坐标,字会随视角旋转、被面片挡住;子图编号 (a)、单位说明这类必须在固定位置的文字用 text2D + transAxes(0~1 的相对画布坐标)。
注意事项
- 判断“这个方法在 3D 里到底行不行”的唯一可靠办法是画出来看,
hasattr全是True。 ax.plot的两参数形式ax.plot(x, y)在 3D 上等价于z=0,会得到一条贴底的线。ax.legend()正常,但图例框固定在画布的二维层,不会跟着投影走。ax.grid(True)对 3D 有效(画三张面板上的网格线),ax.spines无效。
坐标轴、刻度与 z 缩放
set_zlim / invert_zaxis / set_zscale
import matplotlib.pyplot as plt
import numpy as np

x = np.linspace(0.1, 100, 40)
X, Y = np.meshgrid(x, x)
Z = np.hypot(X, Y)

fig = plt.figure(figsize=(4.2, 3.6))
ax = fig.add_subplot(projection='3d')
ax.plot_surface(X, Y, Z, cmap='viridis', linewidth=0)

ax.set_zscale('log')                       # z 轴对数
print(ax.get_zscale())
# 输出: log
ax.invert_zaxis()                          # 反过来:0 在上
print(round(ax.get_zlim()[0], 1) > round(ax.get_zlim()[1], 1))
# 输出: True
plt.close(fig)set_zscale 支持 'linear' / 'log' / 'symlog' / 'logit'(跟 x/y 一样),'symlog' 记得给 linthresh:
import matplotlib.pyplot as plt

fig = plt.figure()
ax = fig.add_subplot(projection='3d')
for s in ['linear', 'log', 'symlog', 'logit']:
    ax.set_zscale(s)
    print(s, '->', ax.get_zscale())
# 输出: linear -> linear
# 输出: log -> log
# 输出: symlog -> symlog
# 输出: logit -> logit

ax.set_zscale('symlog', linthresh=1)
print('symlog + linthresh ok')
# 输出: symlog + linthresh ok
plt.close(fig)刻度太密:必须手动减少
3D 的刻度标签画在斜着的轴上,默认数量下必然互相重叠。这是 3D 图最常见的“看着很乱”的根因:
import matplotlib.pyplot as plt
from matplotlib.ticker import MaxNLocator

fig = plt.figure()
ax = fig.add_subplot(projection='3d')
ax.set_xlim(0, 100)
print(len(ax.get_xticks()))
# 输出: 6

ax.xaxis.set_major_locator(MaxNLocator(3))
ax.yaxis.set_major_locator(MaxNLocator(3))
ax.zaxis.set_major_locator(MaxNLocator(3))
print(len(ax.get_xticks()))
# 输出: 4
plt.close(fig)set_xlim(0, 100) 后默认给 6 个刻度(0/20/…/100),三个轴加起来 18 个标签挤在三条斜线上。MaxNLocator(3) 的语义是“最多 3 个间隔”,所以最终落在 4 个刻度(0/33/67/100 这一类取整值),干净很多——这是 3D 图的“基本卫生”。
zaxis.set_rotate_label:z 轴标题怎么摆
import matplotlib.pyplot as plt

fig = plt.figure()
ax = fig.add_subplot(projection='3d')
ax.set_zlabel('高度')
print(ax.zaxis.label.get_rotation())
# 输出: 0.0

ax.zaxis.set_rotate_label(False)
ax.zaxis.label.set_rotation(90)
print(ax.zaxis.label.get_rotation())
# 输出: 90.0
plt.close(fig)默认 zlabel 会随视角自动旋转以贴合轴线,get_rotation() 读到的 0.0 表示“还没算”。想强行竖排:先 set_rotate_label(False) 关掉自动,再手动 set_rotation(90)。
三块背景面板的颜色
axes3d.{x,y,z}axis.panecolor 控制盒子三个背板的颜色(默认半透明灰):
import matplotlib.pyplot as plt

print(plt.rcParams['axes3d.zaxis.panecolor'])
# 输出: (0.925, 0.925, 0.925, 0.5)

plt.rcParams['axes3d.zaxis.panecolor'] = (1, 1, 1, 0)      # 全透明
fig = plt.figure()
ax = fig.add_subplot(projection='3d')
ax.plot([0, 1], [0, 1], [0, 1])
plt.close(fig)
print('ok')
# 输出: ok想去掉“盒子”感、让图看起来更轻,就把三块面板的 alpha 设成 0;这是纯样式操作,不影响数据。
axlim_clip:超出轴范围的图元要不要裁
3.10 新加的开关,默认 False——超出 xlim / ylim / zlim 的线段本来会照画不误(2D 里是自动裁掉的):
import matplotlib.pyplot as plt

fig = plt.figure()
ax = fig.add_subplot(projection='3d')
ax.plot([0, 5], [0, 5], [0, 5], axlim_clip=True)
ax.set_xlim(0, 1)
print(ax.get_xlim())
# 输出: (np.float64(0.0), np.float64(1.0))
plt.close(fig)做“局部放大”时这个参数很关键:axlim_clip=True 之后,超出范围的部分被裁掉,不会在轴外拉出一条长线。
注意事项
get_zlim()在还没画任何东西时返回(-0.02, 1.02),不是(0, 1)——3D 轴默认带 2% 的边距(axes3d.automargin=False控制)。invert_zaxis()是可逆的,再调一次就翻回来;set_zlim(a, b)若a > b也同样得到反向轴。contour(..., offset=)的默认值是zlim[0],改zlim会连带挪动等高线位置,所以先设set_zlim再画等高线。- 3D 里
set_xticklabels的标签会跟着轴旋转,长标签几乎必然重叠,能用短刻度就别用文字。
综合示例:一张图讲清三个变量
import matplotlib.pyplot as plt
import numpy as np
from matplotlib.ticker import MaxNLocator

rng = np.random.default_rng(3)
x = np.linspace(-3, 3, 200)
X, Y = np.meshgrid(x, x)
Z = np.sin(np.hypot(X, Y)) * np.exp(-np.hypot(X, Y) / 4)

fig = plt.figure(figsize=(10.2, 3.4))

# 1 曲面 + 底面等高线 + 固定色标
ax = fig.add_subplot(1, 3, 1, projection='3d')
surf = ax.plot_surface(X, Y, Z, cmap='viridis', linewidth=0,
                       rcount=50, ccount=50, vmin=-1, vmax=1)
ax.contour(X, Y, Z, zdir='z', offset=-1.1, levels=8, cmap='viridis')
ax.set_zlim(-1.1, 1.0)
ax.set_box_aspect((1, 1, 0.6))
ax.view_init(elev=24, azim=-56)
ax.set_title('曲面 + 底面投影', fontsize=9)
fig.colorbar(surf, ax=ax, shrink=0.5, pad=0.09, label='z')

# 2 三维柱:zsort 修透明排序
ax = fig.add_subplot(1, 3, 2, projection='3d')
bx, by = np.meshgrid(np.arange(5), np.arange(5))
bx, by = bx.ravel(), by.ravel()
h = rng.random(bx.size)
ax.bar3d(bx, by, np.zeros_like(bx), 0.7, 0.7, h,
         color=plt.cm.plasma(h / h.max()), alpha=0.9, zsort='average')
ax.set_box_aspect((1, 1, 1.1))
ax.view_init(elev=32, azim=-52)
ax.set_title('bar3d + zsort', fontsize=9)

# 3 散点:颜色编码深度 + depthshade
ax = fig.add_subplot(1, 3, 3, projection='3d')
pts = rng.normal(size=(3, 600))
ax.scatter(*pts, c=pts[2], cmap='coolwarm', s=8, depthshade=True, alpha=0.9)
ax.set_box_aspect((1, 1, 0.7))
ax.view_init(elev=20, azim=-64)
ax.set_title('scatter + 颜色编码深度', fontsize=9)

for ax in fig.axes:
    if ax.name != '3d':                    # colorbar 的 cax 混在里面,必须跳过
        continue
    ax.xaxis.set_major_locator(MaxNLocator(3))
    ax.yaxis.set_major_locator(MaxNLocator(3))
    ax.zaxis.set_major_locator(MaxNLocator(3))
    ax.tick_params(labelsize=6.5, pad=-2)

fig.tight_layout()
print(len(fig.axes), [a.name for a in fig.axes])
# 输出: 4 ['3d', 'rectilinear', '3d', '3d']
plt.close(fig)这段输出值得盯两秒:fig.axes 是 4 个,而且第 2 个是 'rectilinear'——那是 colorbar 的 cax。它插在第二个位置,不是追加在末尾,因为 cax 是在第一张图调用 fig.colorbar() 时创建的,比第 2、3 张图都早。
所以按位置切片是错的写法:
import matplotlib.pyplot as plt
import numpy as np
from matplotlib.ticker import MaxNLocator

z = np.ones((3, 3))
fig = plt.figure()
a = fig.add_subplot(1, 2, 1, projection='3d')
surf = a.plot_surface(z, z, z)
fig.colorbar(surf, ax=a)                   # 这一步把 cax 插到索引 1
fig.add_subplot(1, 2, 2, projection='3d').plot([0, 1], [0, 1], [0, 1])
print([x.name for x in fig.axes])
# 输出: ['3d', 'rectilinear', '3d']

for ax in fig.axes[:2]:                    # 索引 1 是 cax,没有 zaxis
ax.zaxis.set_major_locator(MaxNLocator(3))AttributeError: 'Axes' object has no attribute 'zaxis'正确做法是按 ax.name != '3d' 过滤——不管 cax 插在哪里都对。
三条收尾经验:
- 先想清楚“第三维能不能换成颜色”。能换就别上 3D:热力图 + 等高线的信息密度高一个数量级。
box_aspect+ 刻度数量 + 视角这三项必须显式给,不要交付默认值。- 矢量导出慎用。同样一张曲面
pdf71 KB、svg424 KB,png只要 48 KB——3D 图放网页优先 png(dpi 200 以上),投稿放 pdf。