文章Matplotlib第 4 章
散点图
Matplotlib · 第 4 / 43 章
散点scatter()
比 plot 多两个能力——每个点的大小可以不同(气泡图)、每个点的颜色可以不同并映射到色条。这两个能力让它能在一张二维图里塞进 4 个变量(x, y, size, color)
Python4 行
ax.scatter(x, y, s=None, c=None, marker=None,
           cmap=None, norm=None, vmin=None, vmax=None,
           alpha=None, linewidths=None, edgecolors=None,
label=None, **kwargs)| 参数 | 含义 | 说明 |
|---|---|---|
s |
点面积 | 标量或数组,单位 pt²;s=100 的直径约 10pt |
c |
点颜色 | ① 单个颜色 ② 颜色列表 ③ 数值数组(配合 cmap 做色条) |
cmap |
颜色映射 | 仅当 c 是数值时生效 |
norm |
归一化方式 | 如 matplotlib.colors.LogNorm() |
vmin / vmax |
色阶两端 | 多图对比时务必固定 |
marker |
标记形状 | 同上 plot |
alpha |
透明度 | 点重叠严重时 0.3~0.6 |
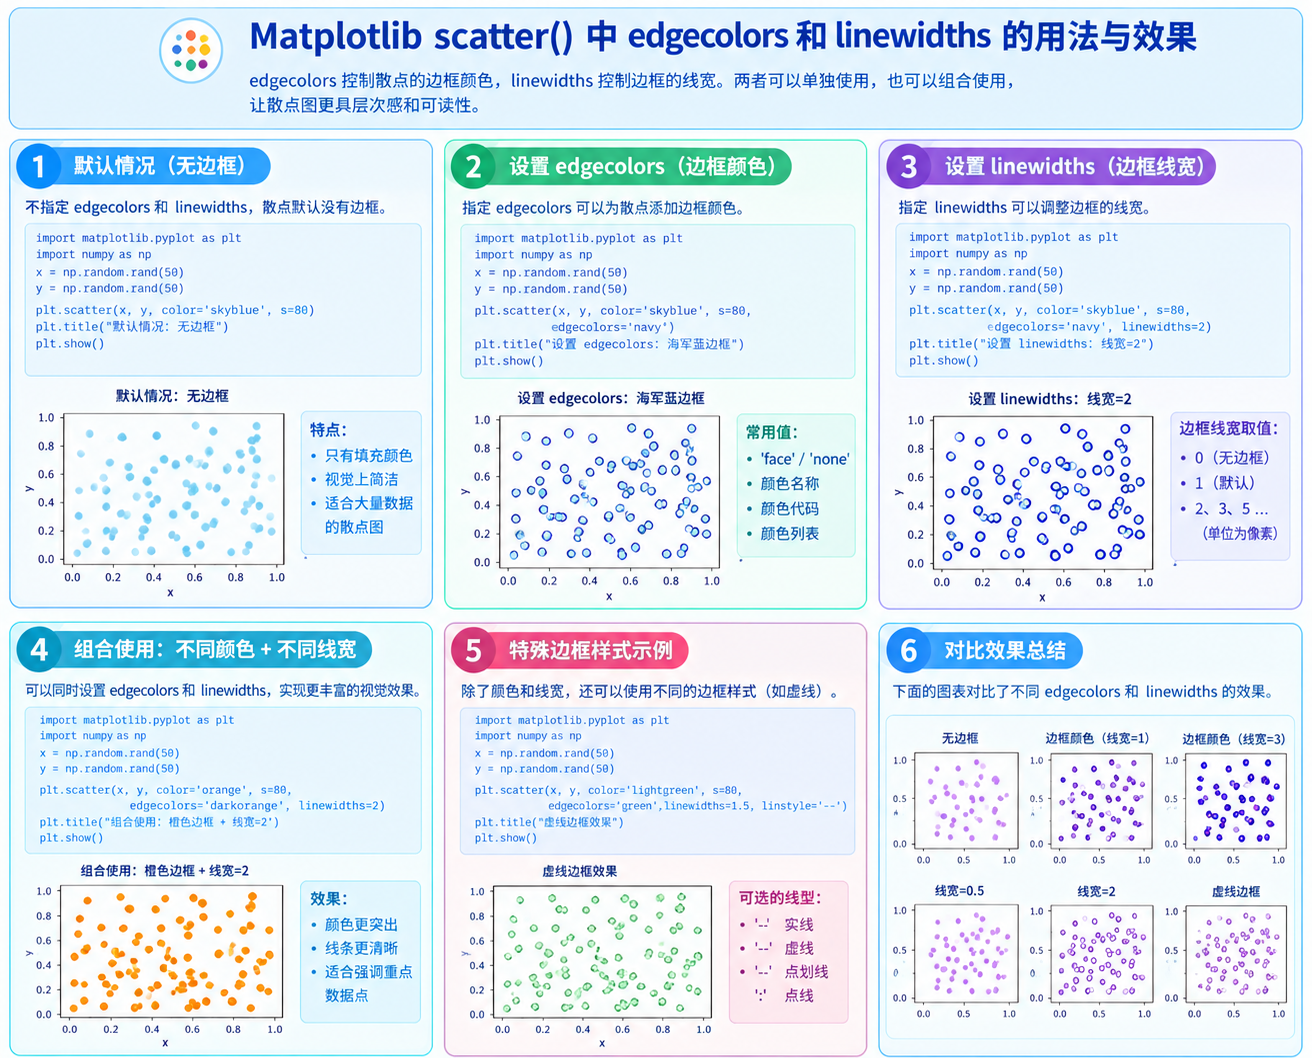
linewidths |
点边框宽度 | 复数,与 plot 的 linewidth 不同 |
edgecolors |
点边框颜色 | 复数;"face" 表示与填充同色,"none" 不画边框 |
plotnonfinite |
是否绘制 nan/inf 点 | 默认 False(跳过) |
简单的散点图示例:
Python9 行
import numpy as np
import matplotlib.pyplot as plt

x = np.random.randn(100)
y = np.random.randn(100)

fig, ax = plt.subplots()
ax.scatter(x, y)
plt.show()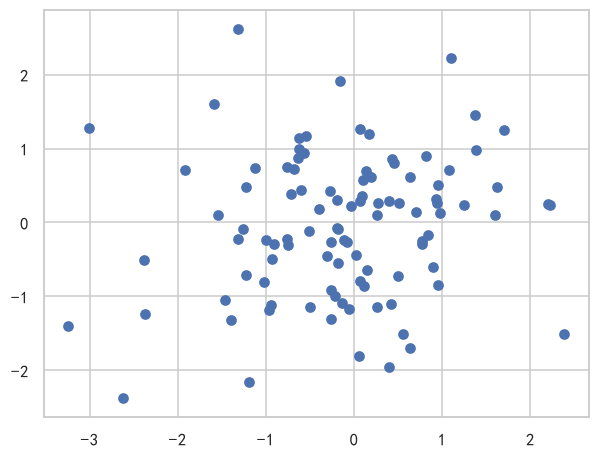
关于颜色
1.当c是单个颜色时,所有散点都会使用这一种颜色
Python4 行
x = np.random.rand(30)
y = np.random.rand(30)

plt.scatter(x, y, c='blue')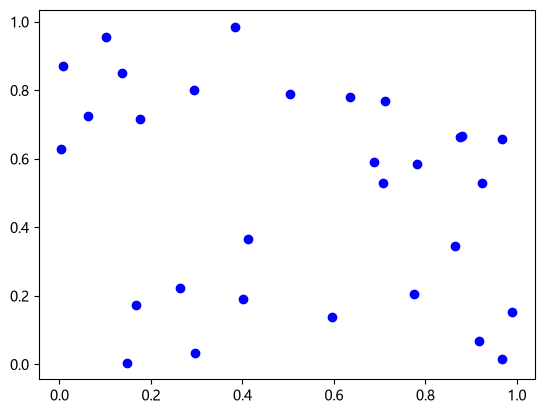
2.当c是颜色列表时,每个数据点使用列表中对应的颜色, 如果颜色列表长度小于数据数,会报错
Python6 行
x = np.random.rand(10)
y = np.random.rand(10)
colors = ['r', 'g', 'b', 'orange', 'purple',
          'cyan', 'magenta', 'yellow', 'brown', 'gray']

plt.scatter(x, y, c=colors, s=100, marker='D')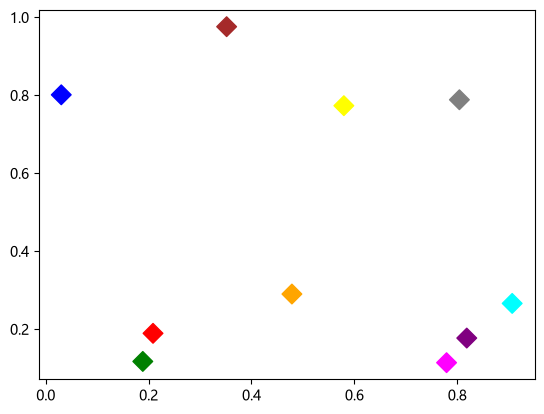
3.当c是数值数组时,会根据数值大小映射为颜色
Python6 行
x = np.random.rand(100)
y = np.random.rand(100)
values = np.random.rand(100)

sc = plt.scatter(x, y, c=values)
plt.colorbar(sc)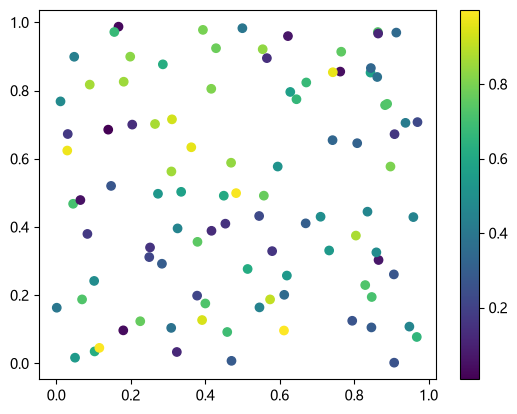
4.当c是分类变量时
Python8 行
import matplotlib.pyplot as plt
import numpy as np

x = np.random.rand(50)
y = np.random.rand(50)
labels = np.random.randint(0, 3, size=50)
sc = plt.scatter(x, y, c=labels, cmap='tab10')
plt.colorbar(sc)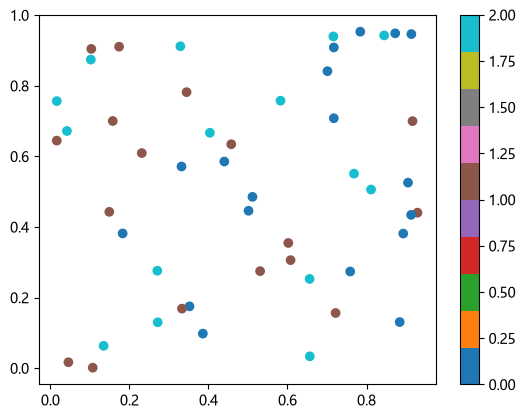
颜色映射
1.使用不同的cmp
Python14 行
np.random.seed(0)
x = np.random.rand(100)
y = np.random.rand(100)

fig, axes = plt.subplots(1, 4, figsize=(16, 3))
cmap_list = ['viridis', 'plasma', 'coolwarm', 'gray']

for ax, cmap in zip(axes, cmap_list):
    sc = ax.scatter(x, y, c=x, cmap=cmap, s=50)
    ax.set_title(cmap)
    ax.set_xticks([]); ax.set_yticks([])
    plt.colorbar(sc, ax=ax, label='x')

plt.tight_layout()
2.使用自定义颜色列表
Python11 行
import matplotlib.pyplot as plt
from matplotlib.colors import LinearSegmentedColormap

# 自定义颜色列表
colors = ['#1f77b4', '#17becf', '#98df8a', '#ff7f0e', '#d62728']
cmap_custom = LinearSegmentedColormap.from_list('custom', colors, N=256)

x = np.random.rand(100)
y = np.random.rand(100)
sc = plt.scatter(x, y, c=x, cmap=cmap_custom, s=50)
plt.colorbar(sc, label='x')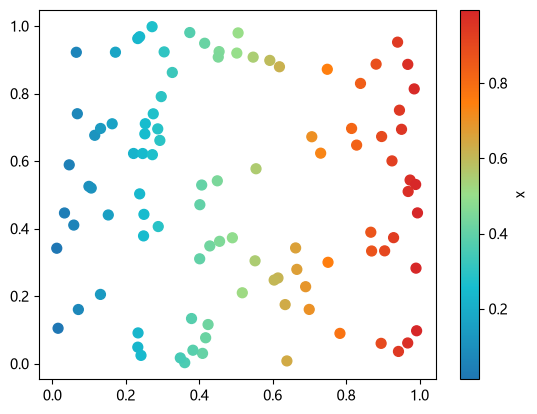
- 感知机二分类
Python22 行
import numpy as np
import matplotlib.pyplot as plt

X = np.array([
    [1, 2], [2, 3], [3, 2],
    [2, 1], [4, 4], [3, 4]
])

y = np.array([1, 1, 1, -1, -1, -1])

plt.scatter(X[y == 1, 0], X[y == 1, 1],
            marker='o', label='+1')

plt.scatter(X[y == -1, 0], X[y == -1, 1],
            marker='s', label='-1')

plt.xlabel('$x_1$')
plt.ylabel('$x_2$')
plt.legend()
plt.grid(alpha=0.3)
plt.show()4.多分类
Python13 行
markers = {0: 'o', 1: 's', 2: '^'}

for label in np.unique(y):
    plt.scatter(
        X[y == label, 0],
        X[y == label, 1],
        marker=markers[label],
        label=f'Class {label}'
    )

plt.legend()
plt.show()3.各种colormap
点击查看
Python52 行
import matplotlib.pyplot as plt
import numpy as np

cmaps = [('Perceptually Uniform Sequential', [
            'viridis', 'plasma', 'inferno', 'magma', 'cividis']),
         ('Sequential', [
            'Greys', 'Purples', 'Blues', 'Greens', 'Oranges', 'Reds',
            'YlOrBr', 'YlOrRd', 'OrRd', 'PuRd', 'RdPu', 'BuPu',
            'GnBu', 'PuBu', 'YlGnBu', 'PuBuGn', 'BuGn', 'YlGn']),
         ('Sequential (2)', [
            'gray', 'bone', 'pink', 'spring', 'summer', 'autumn', 'winter',
            'cool', 'Wistia', 'hot', 'afmhot', 'gist_heat', 'copper']),
         ('Diverging', [
            'PiYG', 'PRGn', 'BrBG', 'PuOr', 'RdGy', 'RdBu',
            'RdYlBu', 'RdYlGn', 'Spectral', 'coolwarm', 'bwr', 'seismic',
            'berlin', 'managua', 'vanimo']),
         ('Cyclic', ['twilight', 'twilight_shifted', 'hsv']),
         ('Qualitative', [
            'Pastel1', 'Pastel2', 'Paired', 'Accent', 'okabe_ito',
            'Dark2', 'Set1', 'Set2', 'Set3',
            'tab10', 'tab20', 'tab20b', 'tab20c']),
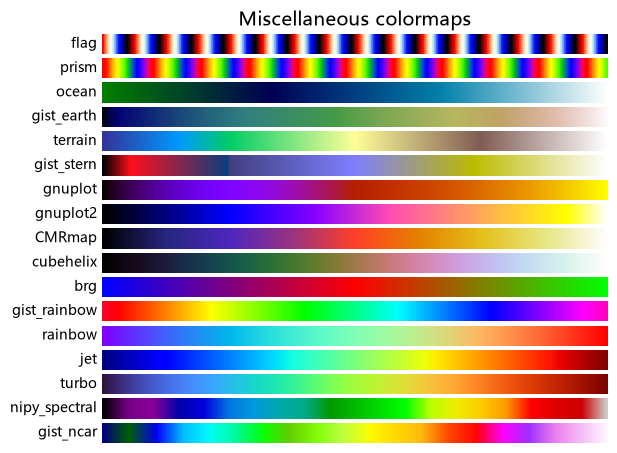
         ('Miscellaneous', [
            'flag', 'prism', 'ocean', 'gist_earth', 'terrain', 'gist_stern',
            'gnuplot', 'gnuplot2', 'CMRmap', 'cubehelix', 'brg',
            'gist_rainbow', 'rainbow', 'jet', 'turbo', 'nipy_spectral',
            'gist_ncar'])]

gradient = np.linspace(0, 1, 256)
gradient = np.vstack((gradient, gradient))


def plot_color_gradients(cmap_category, cmap_list):
    # Create figure and adjust figure height to number of colormaps
    nrows = len(cmap_list)
    figh = 0.35 + 0.15 + (nrows + (nrows-1)*0.1)*0.22
    fig, axs = plt.subplots(nrows=nrows, figsize=(6.4, figh))
    fig.subplots_adjust(top=1-.35/figh, bottom=.15/figh, left=0.2, right=0.99)

    axs[0].set_title(f"{cmap_category} colormaps", fontsize=14)

    for ax, cmap_name in zip(axs, cmap_list):
        ax.imshow(gradient, aspect='auto', cmap=cmap_name)
        ax.text(-.01, .5, cmap_name, va='center', ha='right', fontsize=10,
                transform=ax.transAxes)

    # Turn off *all* ticks & spines, not just the ones with colormaps.
    for ax in axs:
        ax.set_axis_off()


for cmap_category, cmap_list in cmaps:
    plot_color_gradients(cmap_category, cmap_list)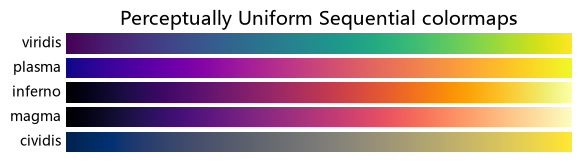
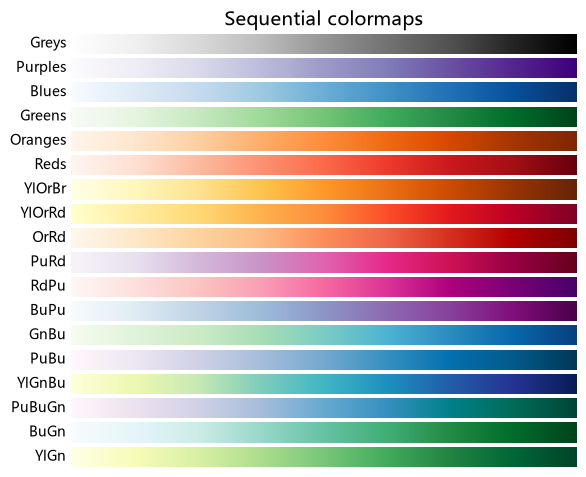
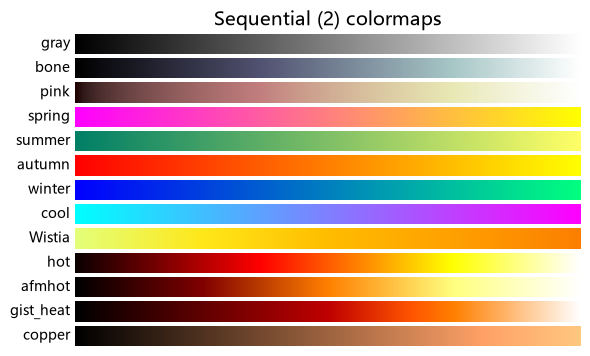
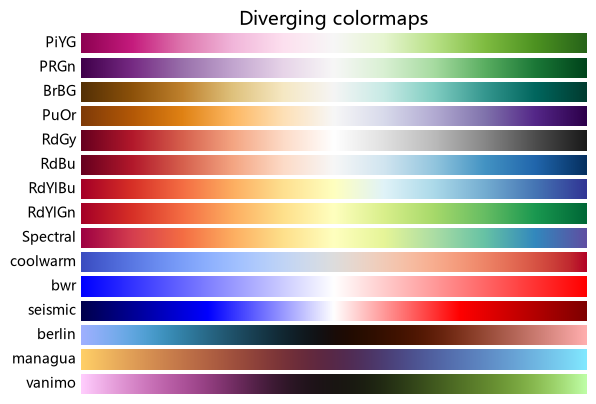

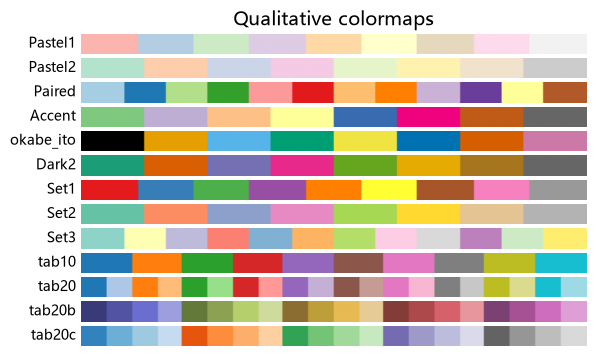
版本
上面这份清单是按 matplotlib 3.11 的内置 colormap 抄的。其中 okabe_ito(无障碍色序)
是 3.11 才新增的,3.10 及以前跑这段会在 cmap='okabe_ito' 处抛
ValueError: 'okabe_ito' is not a valid value for cmap —— 删掉那一项即可。
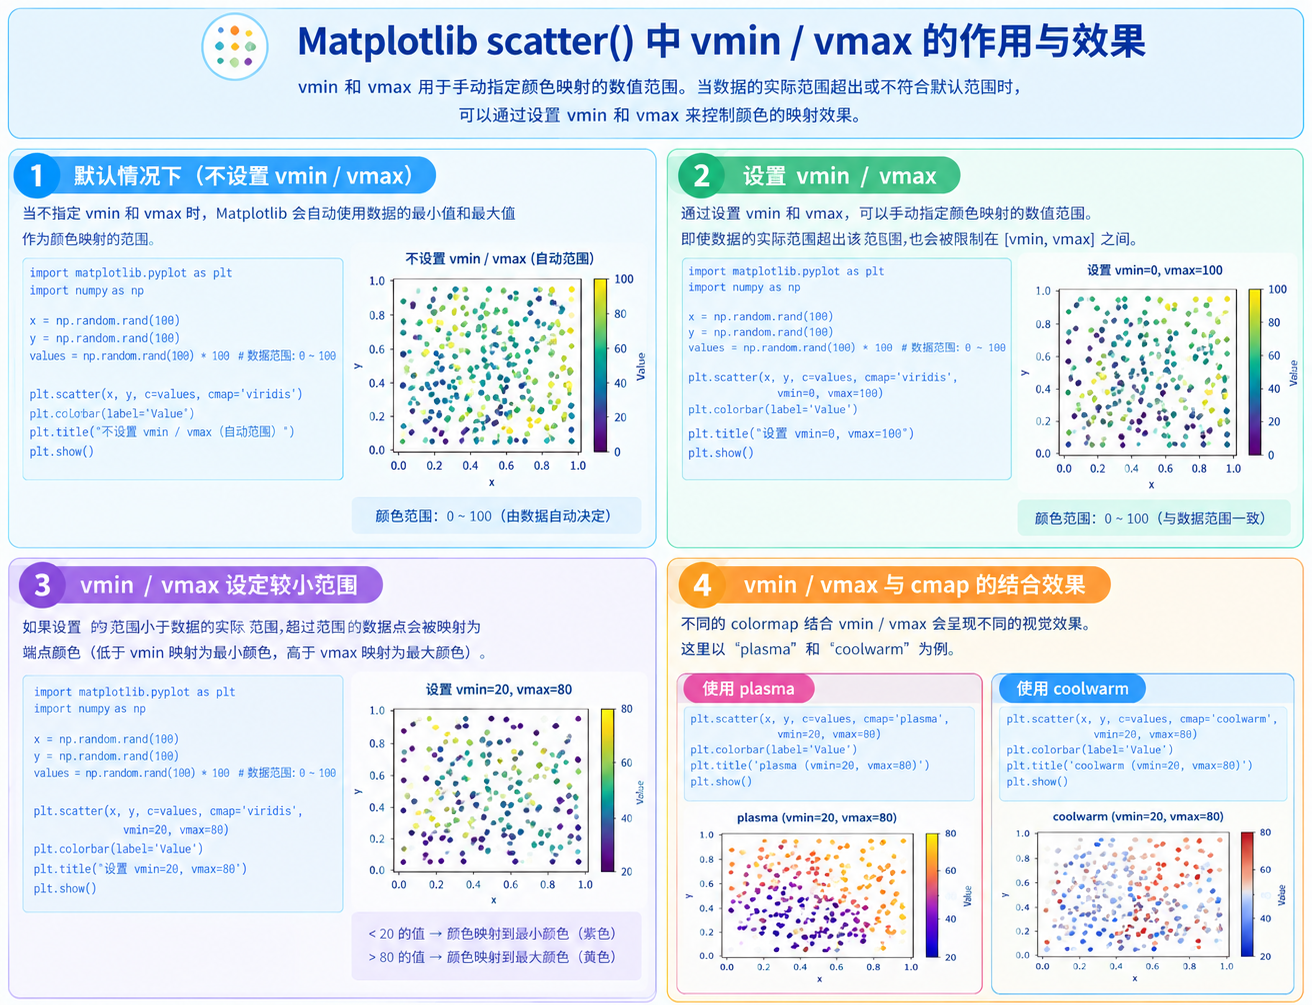
vmin/vmax
通过设置vmin/vmax,可以手动指定颜色映射的数值范围,即使数据的实际范围超出了该范围,也会被限制在[vmin,vmax]
关于vmax/vmin的说明
多图对比时推荐使用
关于edgecolors和linewidths说明